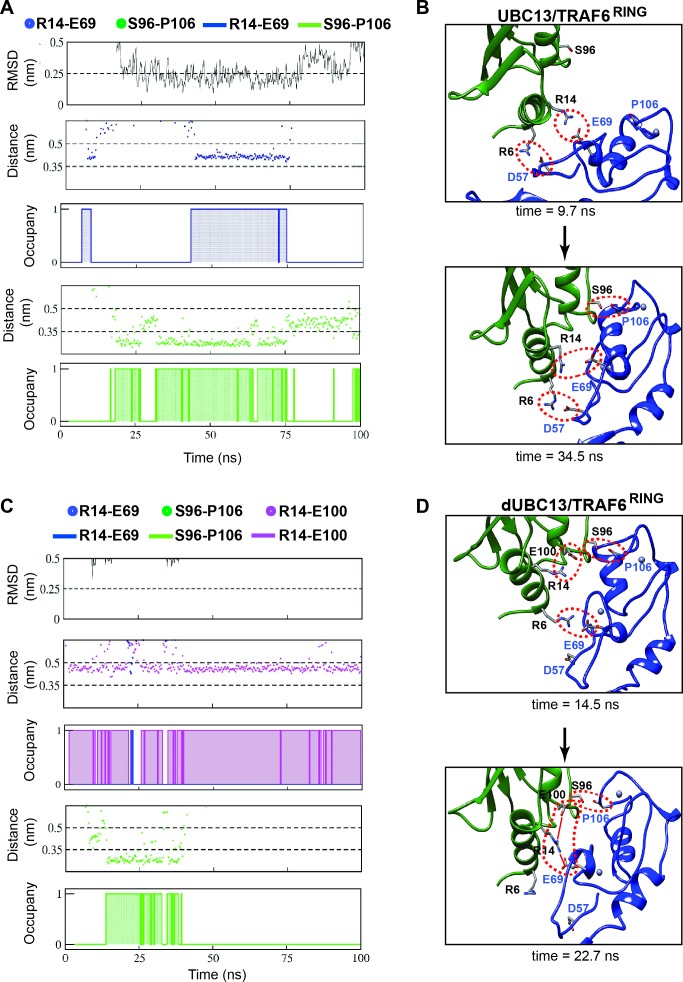
Figure 8. Association pathway of the UBC13/TRAF6 complex from unbiased MD trajectories.
(A) and (C) shows the RMSD of TRAF6RING, the distance between polar contacts and occupancies of polar contacts in UBC13/TRAF6RING and dUBC13/TRAF6RING trajectory, respectively. The occupancies are calculated as in Figure 2B and provided in Supplementary file 1-table S6. (B) Two snapshots from a trajectory in (A) is shown, where the initial contacts formed at 9.7 ns and the native complex formed at 34.5 ns. The polar contacts at the interface are shown by red dotted circles. (D) Two snapshots from a trajectory in (B) is shown, where the transient contacts formed at 14.5 ns, and the salt-bridge competition was observed at 22.7 ns (shown by red lines).
Figure 8—figure supplement 1. Dynamics of R6-D57 salt-bridge and hydrophobic interactions in association MD.


