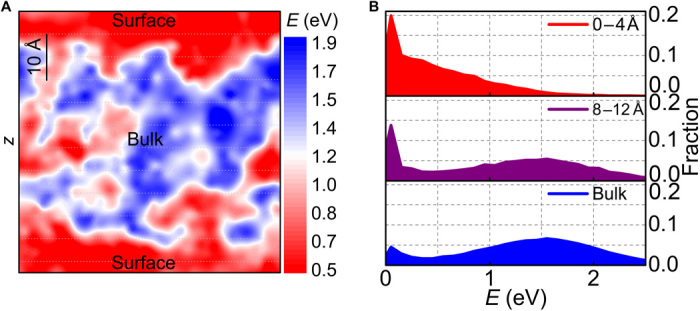
Fig. 1. Activation energy of metallic glass surface through MD simulations.

(A) Activation energy map obtained by MD simulation. (B) Distribution of the activation energies at different distances away from the surface.

(A) Activation energy map obtained by MD simulation. (B) Distribution of the activation energies at different distances away from the surface.