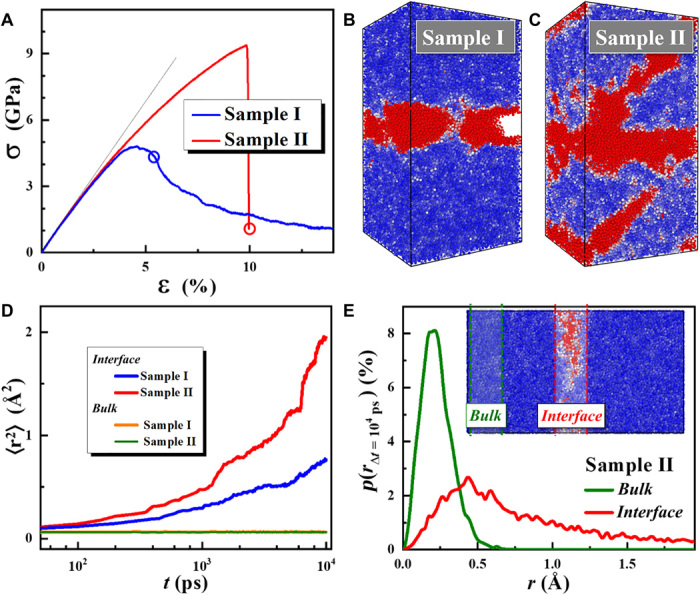
Fig. 6. MD simulation results.

(A) Calculated strain-stress curves of samples I and II, which are prepared by two different treatment methods (see Materials and Methods for more details). The data (dashed line) of the as-prepared bulk sample are listed for reference. (B) and (C) are the snapshots of samples I and II colored by nonaffine displacement Dj at yielding point [as marked in (A)]. (D) Calculated MSD 〈r2(t)〉 of the interface region and the bulk region. (E) The probability density p(rΔt) distributions of atomic displacements r(Δt = 104 ps) of the interface region and the bulk region of sample II.
