
Fig. 2. Different crystallization orientation induced by process parameters.
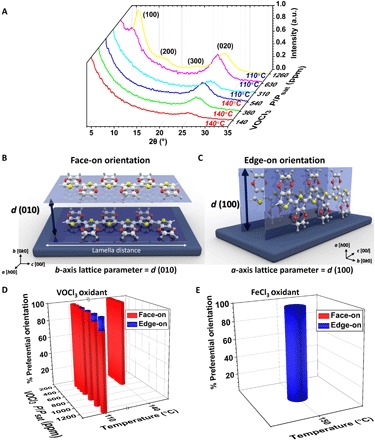
(A) The out-of-plane GIXRD θ − 2θ diffraction patterns of as-deposited PEDOT films grown on silicon substrates at the different deposition temperature of 110° and 140°C with varying VOCl3 saturation ratio. a.u., arbitrary units. Schematic illustration of crystallization orientation and the distance between planes in (B) face-on orientation and (C) edge-on orientation. (D) Summary of the percentage of preferential crystallization orientation in the bar chart for all 16 PEDOT films grown at different deposition temperature and VOCl3 saturation ratio. The percentage of preferential orientation was calculated on the basis of the normalized integrated peak intensities after applying the Lorentz polarization (LP) factor. The lengths of the red-colored and blue-colored bars display the percentage of the face-on and edge-on orientation, respectively. (E) The percentage of preferential crystallization orientation in PEDOT films grown at the deposition temperature of 150°C and using FeCl3 as an oxidant as a comparison with the volatile liquid oxidant (VOCl3) that is used in this study.