
Figure 1.
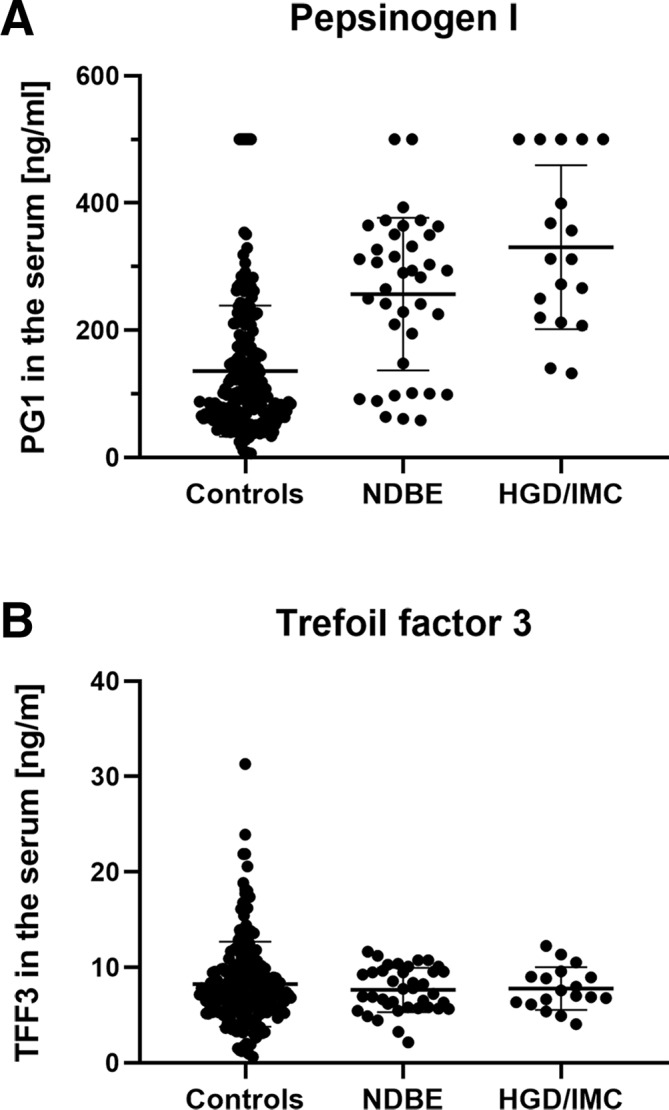
Comparison of serum values for PG1 (A) and TFF3 (B). Displayed is the distribution of serum values for PG1 (A) and TFF3 (B) for individuals with non-dysplastic Barrett’s oesophagus (NDBE), more advanced oesophageal lesions, including high-grade dysplasia and intramucosal cancer (HGD/IMC) and non-Barrett’s ‘controls’. Group comparison was done by Kruskal-Wallis test with significance being assumed for p<0.05.