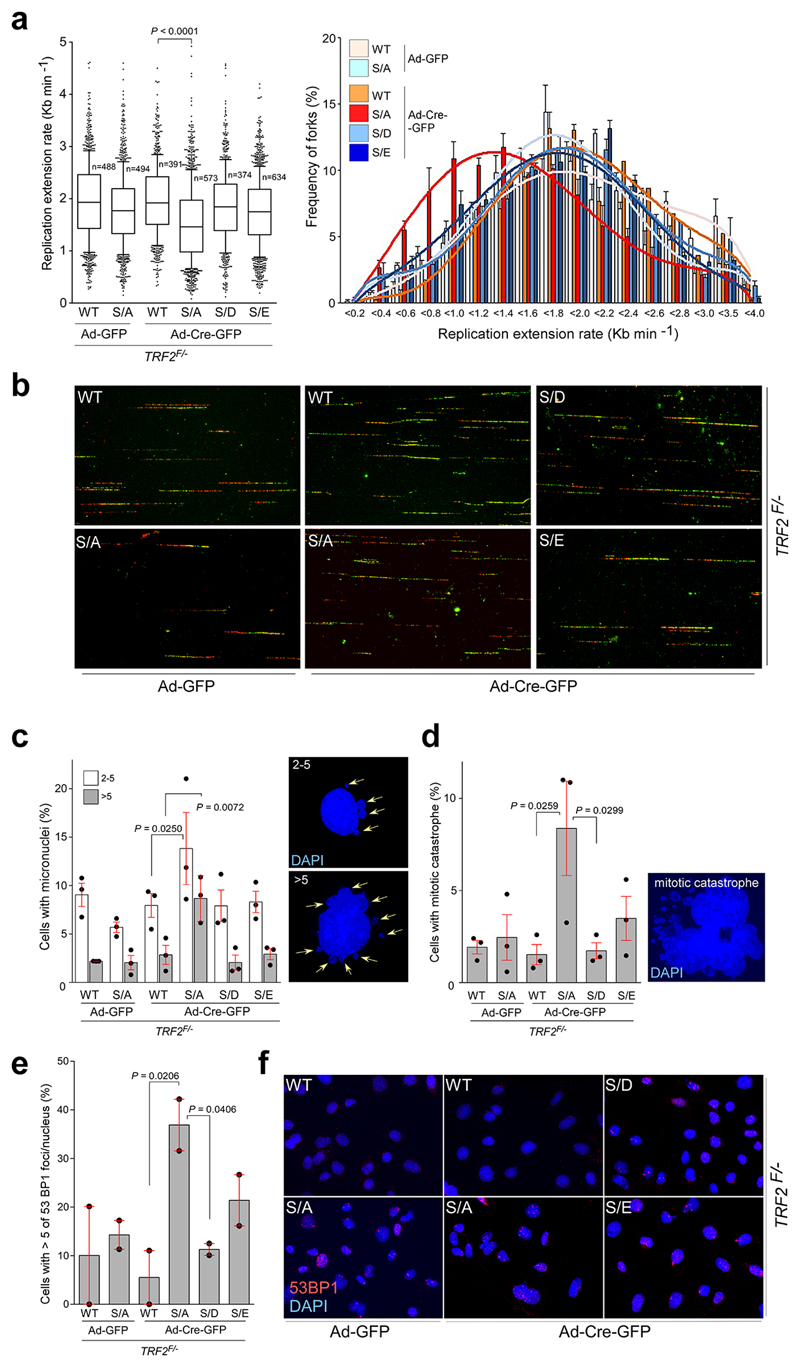
Extended Data Figure 6. Replication defects in TRF2F/- MEFs in the absence of TRF2 phosphorylation at Ser365/367.
a, Quantification of global replication fork dynamics (left panel) and rates of replication fork progression (right panel) of the IdU/CldU double pulse-labelling experiment in TRF2F/- MEFs complemented with empty vector (Ctrl), wild-type Myc-TRF2 (WT), phospho-dead mutant TRF2S367A (S/A), or phospho-mimetic mutants of Myc-TRF2S367D and Myc-TRF2S367E (S/D and S/E) performed 96 hr after infection with control- or Cre-expressing adenovirus (one-way ANOVA, mean ± SEM; n=number of analysed forks, box and whisker plot with 10-90 percentile, data of triplicate experiments). b, representative images of the experiment from (a) c-e, Quantification of micronuclei (c; 500 nuclei/replicate), mitotic catastrophe (d; 500 nuclei/replicate), and 53BP1 foci frequency (e; 150 nuclei/replicate) in TRF2F/- MEFs complemented as detailed in (a). Data represent the average of three (c, d; n=3) or two (e; n=2) independent experiments as mean ± SEM (one-way ANOVA). f, DNA damage in TRF2F/- MEFs complemented as detailed in (a) was estimated by counting the frequency of cells with five or more than five 53BP1 foci. For each independent experiment (n=2), a minimum of 150 nuclei of each condition were analysed.

