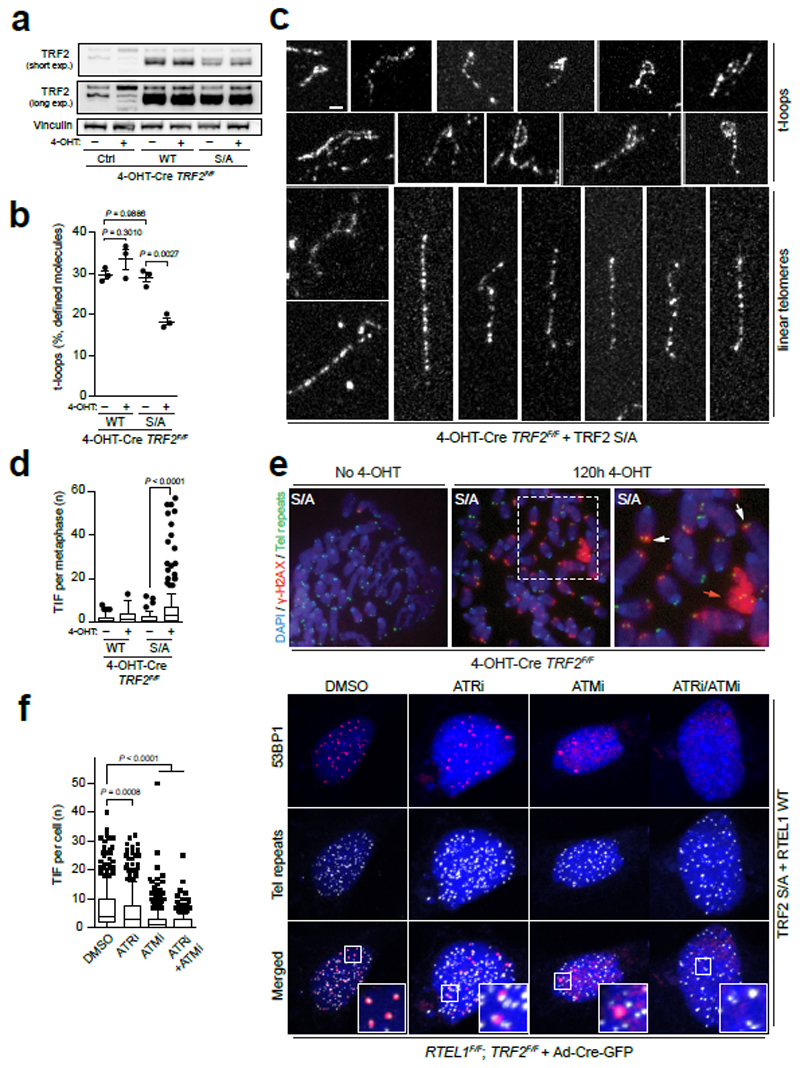
Figure 4. Expression of the TRF2S367A mutant promotes TIFs and impairs t-loop formation.
a, Western blotting analysis of cells of the indicated genotype: (Ctrl), wild-type Myc-TRF2 (WT) or phospho-dead mutant Myc-TRF2S367A (S/A). b, Quantitation of t-loops observed in TRF2F/F MEFs expressing wild-type Myc-TRF2 (WT) or Myc-TRF2S367A (S/A) ± 120 hr 4-OHT. Data are exclusive of ambiguous molecules (one-way ANOVA, mean ± SEM, n = 3 biological replicates scoring ≥ 1192 molecules per replicate). c, Representative images of t-loops and linear telomeres identified by Airyscan super-resolution imaging. Bar = 1 µm. d, Quantitation of metaphase-TIFs assays (one-way ANOVA, mean ± SEM; n= 120 metaphases, box and whisker plot with 10-90 percentile). e, Representative images of metaphase-TIF assays. TIF examples (white arrows) and mitotic catastrophe (red arrow) are shown. f, Quantitation (left panel) of interphase-TIF assay in cells of the indicated genotype ± ATR or/and ATM inhibition. (one-way ANOVA, mean ± SD; n> 300 nuclei, box and whisker plot with 10-90 percentile). Representative images of interphase-TIF assay +/- ATR/ATM inhibitors are shown in the right-hand panel. Co-localisation of 53BP1 and telomeres is shown in the merged panels. In a, c, d - f the experiments were independently repeated at least three times with similar results.

