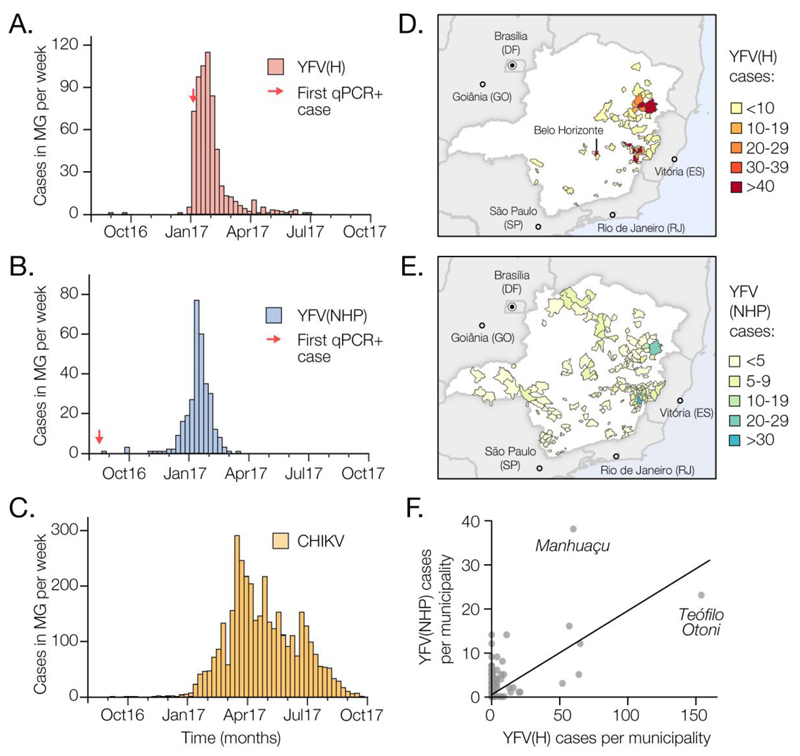
Fig. 1. Spatial and temporal epidemiology of YFV and CHIKV in Minas Gerais, MG.
(A) Time series of human YFV cases in MG (676 cases across 61 municipalities) confirmed by serology, RT-qPCR or virus isolation during the first YFV epidemic wave (Aug 2016 to Oct 2017). (B) Same as panel A, but showing NHP YFV cases (313 cases across 90 municipalities), confirmed by RT-qPCR. (C) Same as panel A, but for human CHIKV cases (3668 cases across 129 municipalities). (D) Geographic distribution of human YFV cases in MG. (E) Geographic distribution of NHP YFV cases in MG. Fig. S2 shows the corresponding geographic distribution of CHIKV cases. (F) Association between the number of human and NHP cases in each municipality of MG (Pearson’s r=0.62; p<0.0001; non-parametric Spearman’s rank ρ=0.32; p<0.05).

