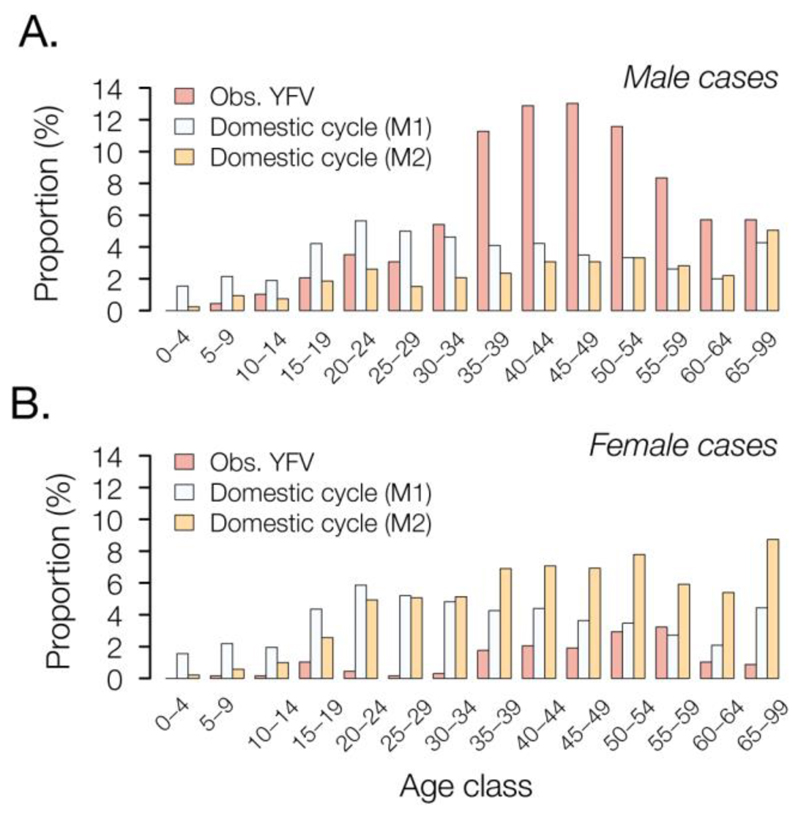
Fig. 2. Age and sex distribution of YFV cases in Minas Gerais, 2016-2017.
Red bars show the proportion of observed YFV cases in Minas Gerais that occur in each age class, in (A) males and (B) females. These empirical distributions are different from those predicted under two models of urban cycle transmission (M1 = white bars and M2 = orange bars; see text for details).

