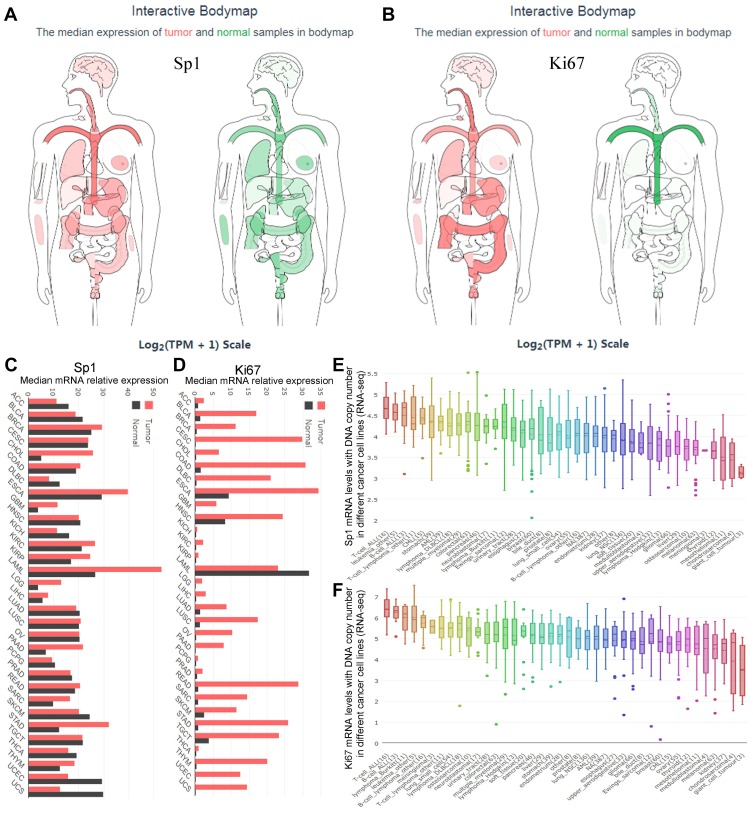
Figure 6.
The expression difference of Sp1 and Ki-67 mRNA in body map and tumor tissues and cell lines. The median expression of Sp1 (A) and Ki-67 (B) mRNA in tumor (red) and normal (green) samples in a body map. Sp1 (C) and Ki-67 (D) expression in different types of tumors and paired normal tissues. Sp1 (E) and Ki-67 (F) expression in different types of tumor cell lines (CCLE website).
Abbreviation: TPM, transcripts per million.

