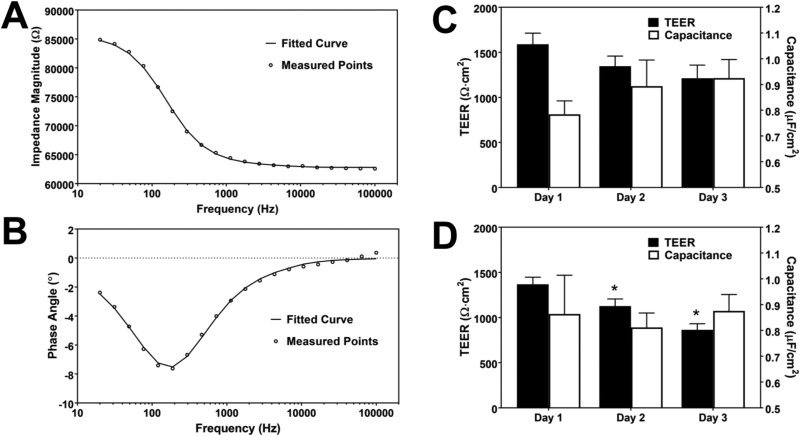
FIG. 6.
Impedance spectroscopy results and the calculated electrical properties of the BMEC layer. (a) and (b) Plot of experimentally measured data points and the model (indicated by the fitted curve) based on the fitted values for impedance magnitude (a) and phase angle (b) as a function of frequency for devices with BMECs. (c) and (d) TEER and the normalized membrane capacitance of the BMEC layer in devices with a hydrogel in the basolateral channel with 0.4 μm (c) and 8.0 μm (d) membrane evaluated 1, 2, and 3 days after seeding BMECs in the devices. Each group consists of 3 devices (* indicates P < 0.01 compared to the previous day).

