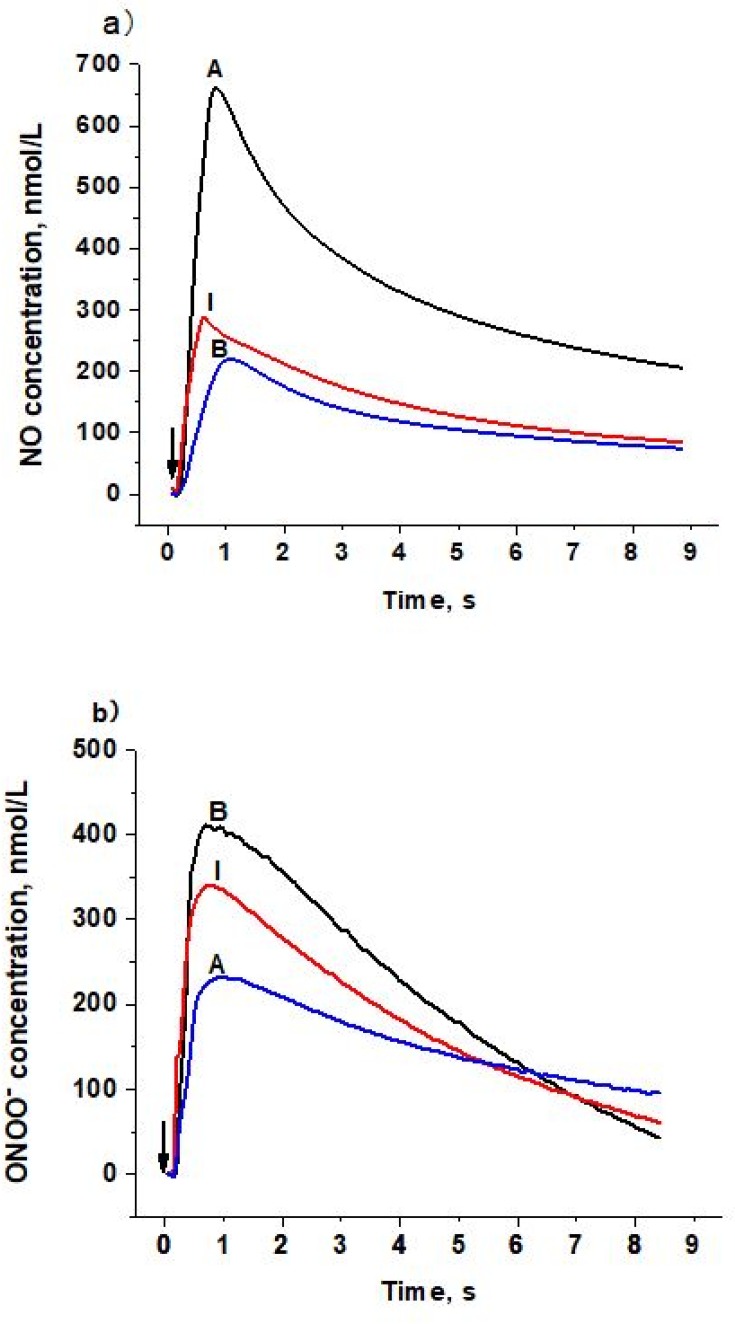
Figure 1.
Amperograms (current calibrated as concentration vs time) of NO and ONOO− release stimulated by LDL with different patterns on the surface of endothelial cells. a) NO release from endothelial cells stimulated by LDL (Patterns A, B, and I, 1,000 µg/mL). b) ONOO− release from endothelial cells stimulated by LDL (Patterns A, B, and I, 1,000 µg/mL). Arrows indicate LDL injection.

