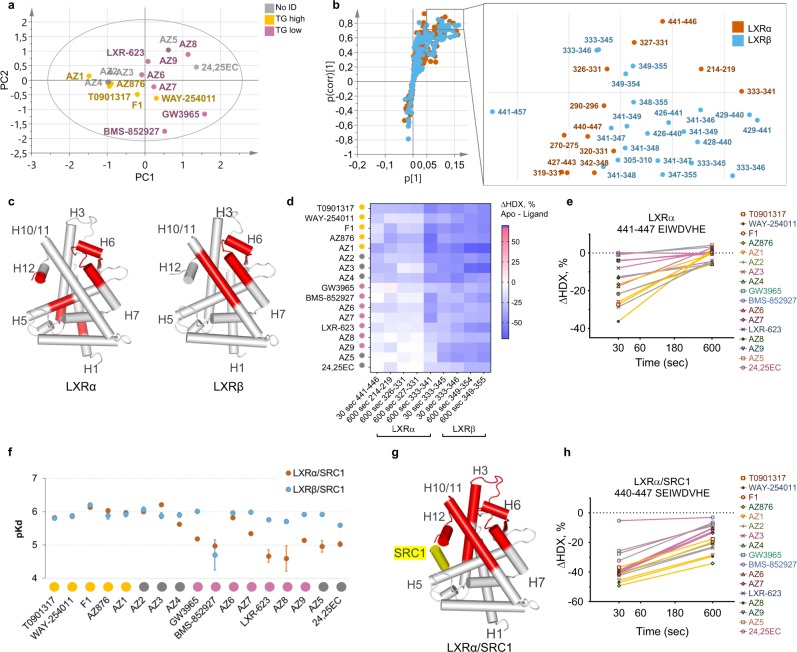
Fig. 3.
LXR ligands inducing high plasma TG stabilize active receptor conformation. a PCA score scatter plot of the first two principal components. Yellow dots: lipogenic LXR ligands, purple dots: non-lipogenic LXR ligands, and gray dots: compounds with no assigned TG class. R2X(cum) = 83.4%, Q2(cum) = 62.9%, n = 17. b S plot of the TG OPLS-DA model and the zoomed-in part of the plot representing limits used for the selection of differential peptides with the highest contribution to class separation (|p(corr)| > 0.7, p > 0.05). Orange dots: LXRα peptides, cyan dots: LXRβ peptides. c Statistically significant (p-value < 0.05, two-tailed Student’s t test) predictive peptides mapped on the LXRα (2ACL.pdb) and LXRβ (1PQC.pdb) crystal structures. d Average differences in deuteration levels of the differential peptides having the highest correlation to the class separation (|p(corr)| > 0.8). e Differential deuterium uptake levels of the LXRα peptide 441–447 in the presence of lipogenic (yellow) and non-lipogenic (purple) compounds. Ligands not assigned to any TG class are shown in gray. f Binding affinities of LXRα (orange circles) and LXRβ (cyan circles) to the immobilized coactivator peptide measured by SPR (±standard error). TG compound classes are shown below for clarity: lipogenic ligands in yellow, non-lipogenic in purple, and compounds with no assigned TG class in gray. Original sensorgrams and derived equilibrium-binding affinity parameters are shown in Supplementary Fig. 13 (LXRα) and Supplementary Fig. 14 (LXRβ). g Statistically significant (p-value < 0.05, two-tailed Student’s t test) predictive peptides mapped on the LXRα crystal structure (2ACL.pdb). h Differential deuterium uptake levels of the LXRα peptide 441–446 in the presence of lipogenic (yellow) and non-lipogenic (purple) compounds and the SRC1 coactivator peptide. Ligands not assigned to any TG class are shown in gray. HDX-MS data were collected in triplicate, and deuteration data are normalized to the fully deuterated control (±standard deviation).

