Fig. 6.
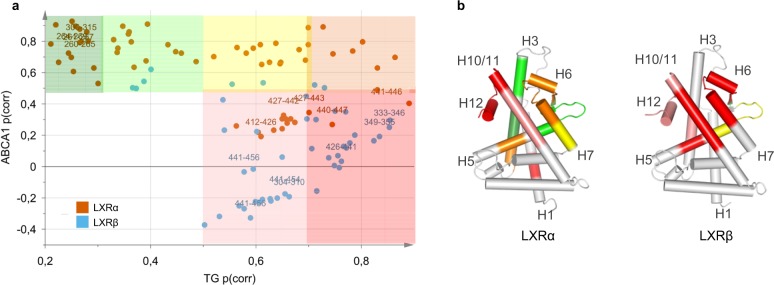
SUS analysis of TG and ABCA1 OPLS-DA models identifies potential directions for development of ligands with improved therapeutic profiles. SUS plot (a) and the corresponding p(corr) values mapped on the crystal structures of LXRα (2ACL.pdb) and LXRβ (1PQC.pdb) (b) according to shared color code. Dark green: p(corr) ABCA1 > 0.5, p(corr) TG < 0.3; light green: p(corr) ABCA1 > 0.5, 0.3 < p(corr) TG < 0.5; yellow: p(corr) ABCA1 > 0.5, 0.5 < p(corr) TG < 0.7; orange: p(corr) ABCA1 > 0.5, p(corr) TG > 0.7; red: p(corr) ABCA1 < 0.5, p(corr) TG > 0.7; pink: p(corr) ABCA1 < 0.5, 0.5 < p(corr) TG < 0.7. For clarity, peptides with low contribution to the class separation for both models (p < 0.05, p(corr) ABCA1 < 0.5, p(corr) TG < 0.5) were excluded. A complete list of p(corr) values for both models is provided in Supplementary Table 8.

