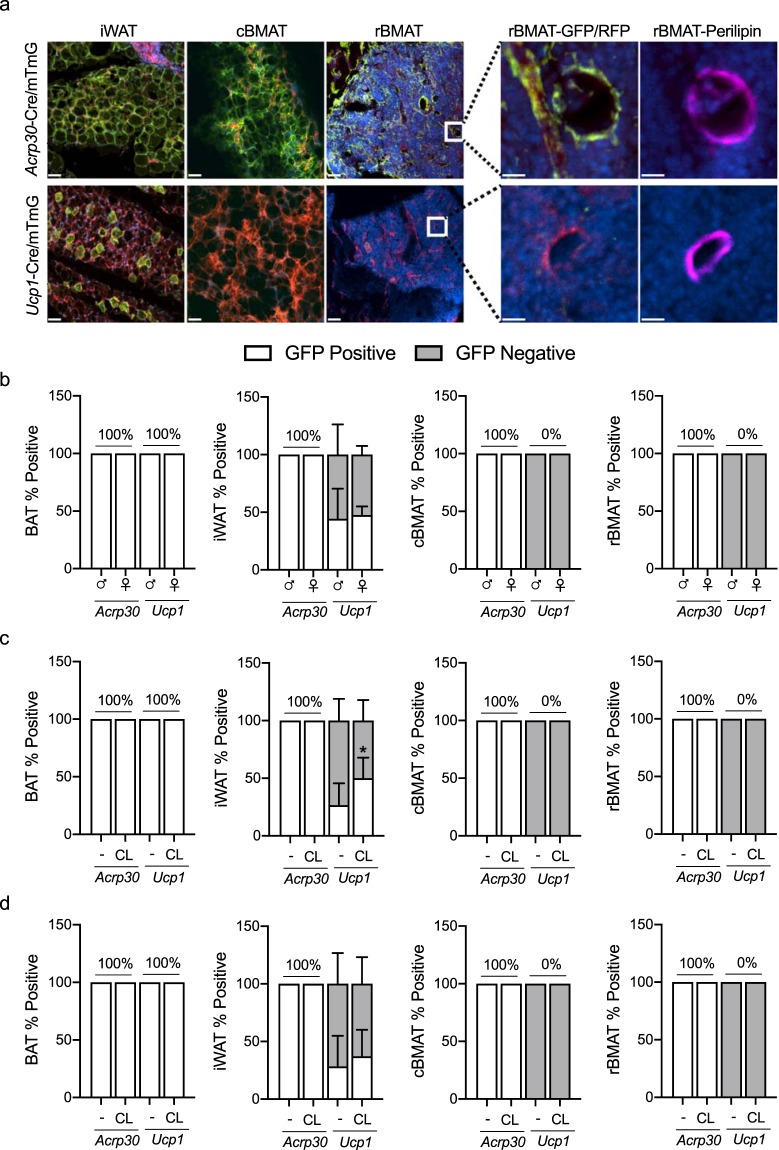
Figure 4.
Adipocytes within the developing skeleton express adiponectin, but not UCP1, by lineage tracing. (a) Representative images of AdipoqCre+/mTmG+ and UCP1Cre+/mTmG+ inguinal white adipose tissue (iWAT), constitutive bone marrow adipose tissue (cBMAT, caudal vertebrae), and regulated bone marrow adipose tissue (rBMAT, tibia). The presence of green (GFP-positive) cells indicates expression of Cre and conversion of the mTmG reporter. White boxes in images show inset for images to the right (GFP/RFP). Far right images (perilipin) demonstrate that the adipocytes in the GFP/RFP images are perilipin-positive. Images were acquired at 10X, scale bar is 50 µm or 25 µm for insets. (b–d) Quantification of Adipoq-Cre or Ucp1-Cre-mediated GFP expression in adipocytes relative to total number of adipocytes. White bars are the percent of adipocytes expressing GFP. Grey bars are the percent of adipocytes that do not express GFP (instead express RFP). Tissues collected from 3-week-old male and female mice (b) 16-week-old males (C) or females (d) treated with saline (−) or 0.3 mg/kg CL316,243 (CL) for 6-days. (b–d) Mean ± S.D. Sample sizes: (b) n = 5–6 (c) n = 3–5, (d) n = 3–7.

