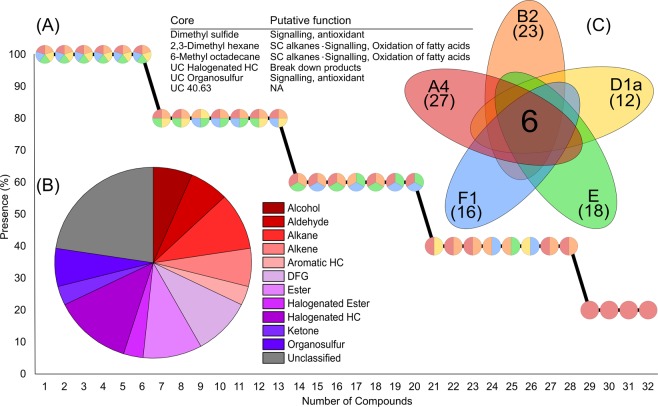
Figure 1.
(A) Number of compounds detected across all Symbiodiniaceae isolates (present in at least 2 out of the 3 biological replicates), each pie-chart represents a compound and the colours denote which isolates the compound is present in. (B) The proportion of chemical functional groups across the 32 detected compounds from five Symbiodiniaceae species. (C) Venn style diagram85 showing the six core volatiles and their putative functions, as well as the number of compounds detected in each species (Symbiodinium linucheae (A4, red), Breviolum psygmophilum (B2, orange), Durusdinium trenchii (D1a, yellow), Effrenium voratum (E, green) and Fugacium kawagutii (F1, blue)). HC: hydrocarbon, DFG: diverse functional groups, SC: short chain, UC: unclassified (the number following UC indicates the retention time of the compound if the chemical functional group could not be determined).

