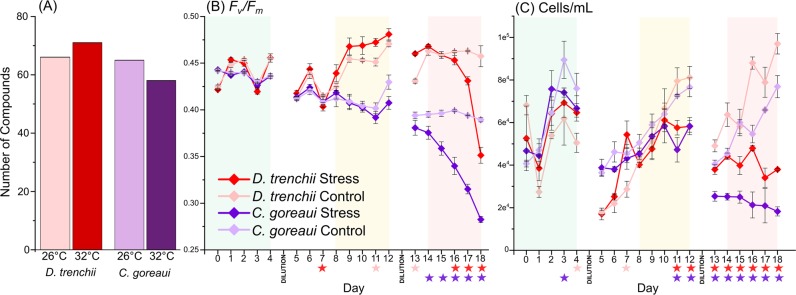
Figure 3.
Total number of compounds (present in at least two out of three replicates) detected in Durusdinium trenchii and Cladocopium goreaui control and stress treatments (A). Photosynthetic health (Fv/Fm) (B) and cell density (cell/mL) (C) of D. trenchii and C. goreaui throughout the thermal stress experiment. Significant differences (P < 0.05; Kruskal Wallis; IBM SPSS version 25) between treatments are indicated with a star, the star colour indicates the significantly decreased treatment. Shading on panels (B) and (C) indicates the time period the treatment cultures were held at 26 °C (green), 30 °C (yellow) and 32 °C (red), controls were held at 26 °C throughout, see Fig. S1 for full temperature profile. All error bars are standard error.

