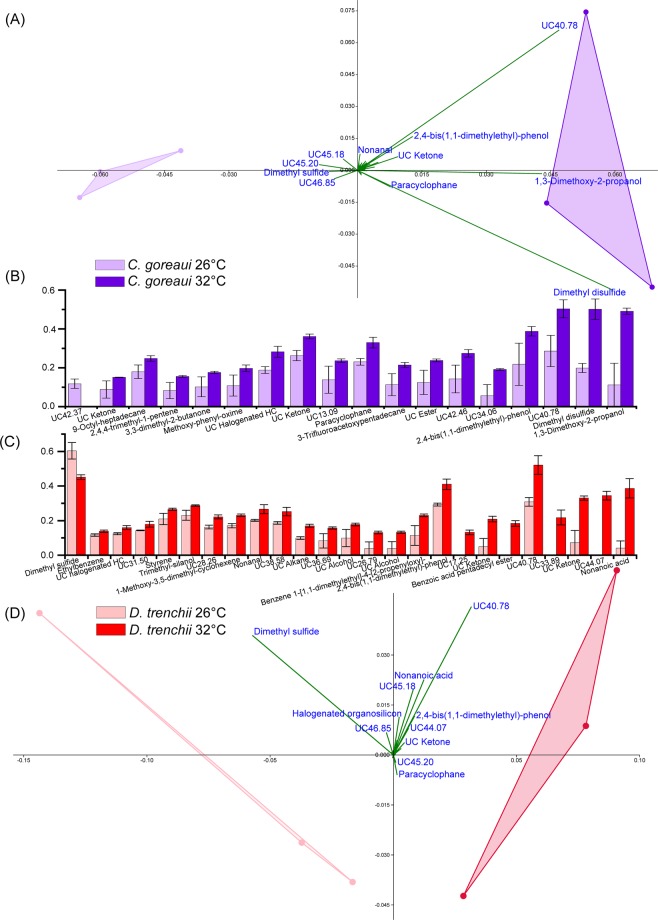
Figure 4.
Principal Component Analysis (PCA) of Cladocopium goreaui (A) (component 1 = 62.1% and component 2 = 29.6% of variance) and Durusdinium trenchii (D) (component 1 = 74.5% and component 2 = 17.7% of variance) during the thermal stress assay experiment (PAST; Bootstrap N = 1000). Fourth root normalised abundance of compounds that varied significantly between control (26 °C) and treatment (32 °C) (P < 0.05; Kruskal Wallis; IBM SPSS version 25) are shown for C. goreaui (B) and D. trenchii (C). All error bars are standard error. HC = Hydrocarbon, UC = Unclassified (the number following UC indicates the retention time of the compound if the functional group could not be determined).

