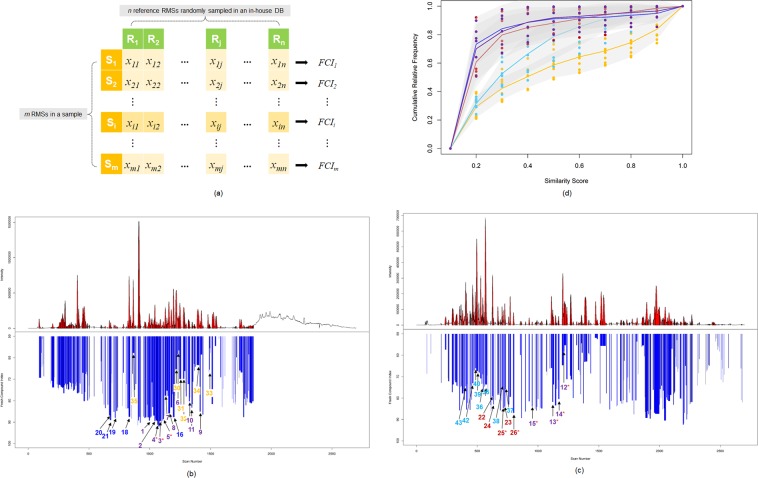
Figure 5.
The symmetric matrix consisting of the similarity score profiles between m RMSs in a sample and n reference RMSs in our in-house database for the HCA (a). xi,j denotes the dot-product similarity score between the ith RMS (Si) in a sample and the jth reference RMS (Sj) in our in-house database. FCIi, the normalized sum of the similarity scores vector of Si, represents the structural novelty of a secondary metabolite in a sample relative to the reference RMSs in our in-house database. The LC chromatograms mapped with RMS are shown in red (upper), and the FCIs profile corresponding to the RMSs (lower) from A. pilosa roots (b) and the aerial parts (c). Compounds 1–43 are shown in violet for pilosanidins (1–5) and pilosanols (6–15), blue for agrimolides (16–22), dark red for chromones (22–26), yellow for triterpenes (23–35) and sky blue for flavonoids (36–43). The newly isolated compounds (3–5, 12–15, 25 and 26) are indicated by a red asterisk. The trend lines of the cumulative relative frequency of the similarity scores of the RMSs corresponding to the chemical scaffolds, pilosanidins and pilosanols (violet), agrimolides (blue), chromones (dark red), triterpenes (yellow) and flavonoids (sky blue) (d). The points and solid lines represent the cumulative relative frequency of the similarity scores, which are separated by intervals of 0.1, of each RMS against the reference RMSs in our in-house database and the mean values of the cumulative relative frequency, respectively. The standard deviations of each interval of the points are shaded in gray.

