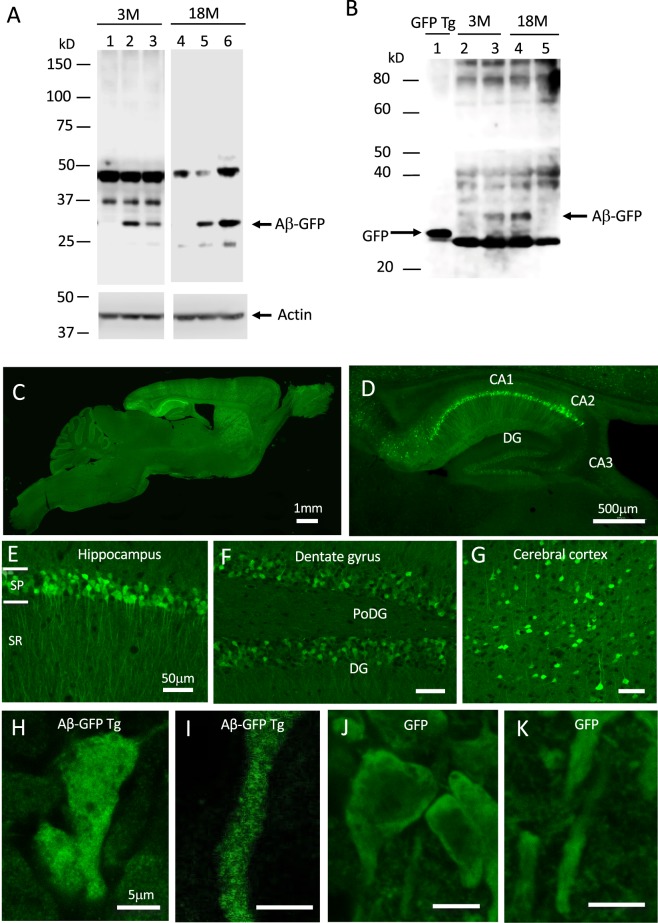
Figure 1.
Expression of Aβ-GFP fusion protein in Aβ-GFP Tg mice brain. (A) Anti- Aβ (6E10) immunoblot analysis of brain homogenates (10 μg/lane) from young (3-months old; 3 M) and aged (18-months old; 18 M) Aβ-GFP Tg (lanes 2, 3, 5, 6) and non-Tg (lanes 1, 4) mice. Aβ-GFP Tg mice showed an immunopositive band around 33 kD that is the expected molecular weight of a monomer of the Aβ-GFP fusion protein. Other bands observed both from Aβ-GFP Tg and non-Tg mouse homogenates, were non-specific. (B) Anti-GFP immunoblot analysis. A strong single band was observed in the GFP-Tg mice (lane 1). As in (A), immunopositive bands around 33 kD were observed only in the homogenate from Aβ-GFP Tg (lanes 3, 4) and not in those from the non-Tg mice (lanes 2, 5). In addition, homogenates from Aβ-GFP Tg mice also contained faint bands at the same position as the GFP Tg. (C,D) Sagittal sections from 12-month-old Aβ-GFP Tg mice. The Aβ-GFP fusion proteins were expressed mainly in cerebral cortex, hippocampus, thalamus, and striatum. The strongest expression was observed in the hippocampal CA1-CA2 region. (E–G) Magnified views of hippocampal CA1 region (E), dentate gyrus (F), and cerebral cortex (G). The fusion proteins were intensely expressed in CA1-CA2 pyramidal cells and their dendrites but only weakly in granule cells in dentate gyrus (DG). (H–K) Magnified views of CA1 pyramidal cell body and its dendrites from Aβ-GFP Tg (H,I) and GFP-Tg mice (J,K). Aβ-GFP fusion protein was distributed as small dots, although GFP alone distributed uniformly in cell body and dendrites. Scale bars; 1 mm (C), 500 μm (D), 50 μm (E–G) and 5 μm (H–K). Abbreviations, SP; stratum-pyramidale, SR; stratum-radiatum, PoDG; polymorphic layer of dentate gyrus.

