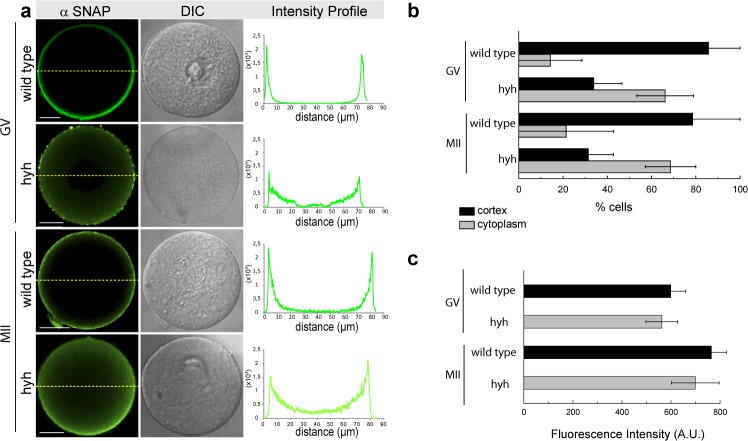
Figure 1.
Alpha-SNAP localization during meiotic maturation in wild type and hyh oocytes. (a) Alpha-SNAP was immunodetected at two different stages during meiotic maturation: Germinal vesicle-intact oocytes (GV) and Metaphase II oocytes (MII). Green indicates positive staining for primary alpha-SNAP antibody detected by a secondary antibody conjugated with DyLight 488; DIC shows differential interference contrast (DIC) images. The right column shows the fluorescence intensity profiles for alpha-SNAP. Fluorescence intensities were measured along dashed yellow lines traced in each oocyte. The intensity of alpha- SNAP is indicated by green lines. Scale bar: 20 μm. (b) Cortical and cytoplasmic patterns of protein distribution. The cortical region was defined as the region of 10 μm thickness from the oocyte plasma membrane towards the oocyte centre. Those cells in which fluorescence decay at 10 μm were considered to present a cortical staining, and those cells which present high fluorescence at 10 μm towards the center and beyond were considered to present cytoplasmic staining. Percentage analysis was assessed. Number of oocytes: GV wild type = 33; GV hyh = 34; MII wild type = 27; MII hyh = 12. (c) Histogram showing fluorescence intensity quantification (A.U.: arbitrary units) for wild type GV and MII oocytes compared to hyh ones.

