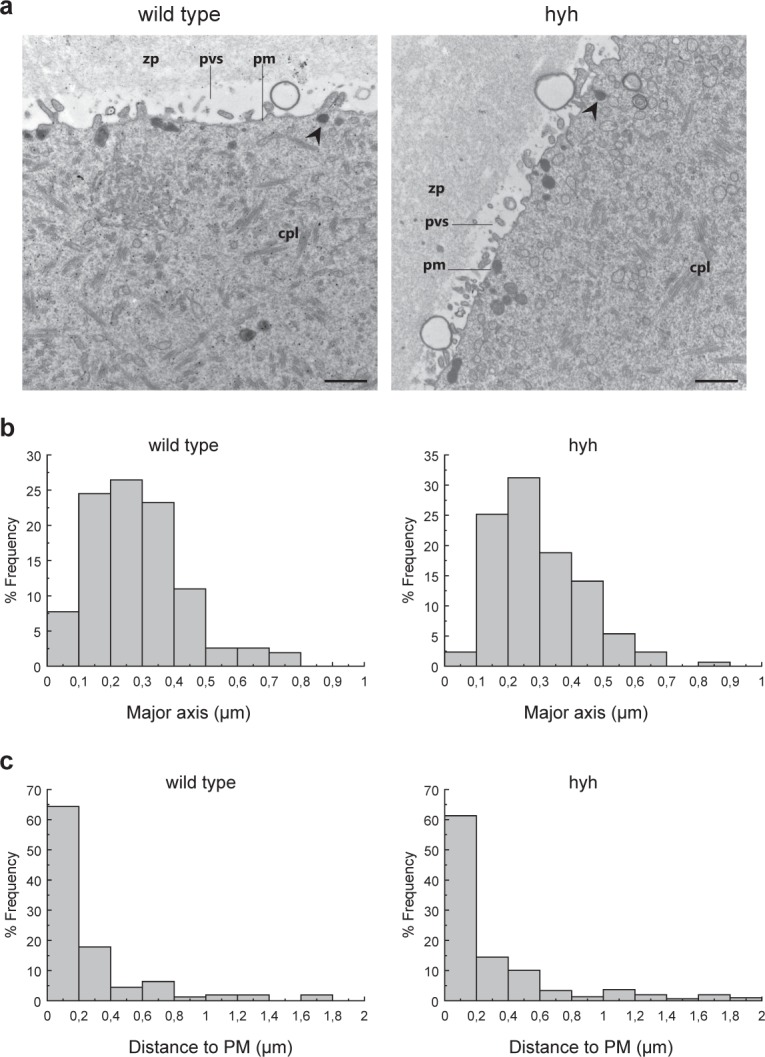
Figure 3.

Cortical granules at the ultrastructural level in wild type and mutant hyh MII oocytes. (a) Representative transmission electron microscopy images of the cortex in MII oocytes (MII) in wild type and mutant homozygous (hyh) mice.Cortical granules (arrow heads) are linearly arranged below the plasma membrane. Note microvillous processes of oolema. zp: zona pellucid; pvs: perivitelline space; pm: plasma membrane; cpl: cytoplasmic lattice. Scale bar: 1 μm. Frequency histograms were plotted for cortical granules size (major axis) (b) and distance to the plasma membrane (c). Values on the x-axis represent bins of size (a) or distance (b) data. The number of analyzed cortical granules (CG) and images are the same as in Table 2. Data were compared using the Kolmogorov-Smirnov test for two sets of data. Individual size and CG distances in wild type and hyh oocytes show similar distribution profiles (N.S. p > 0.05).
