Figure 9.

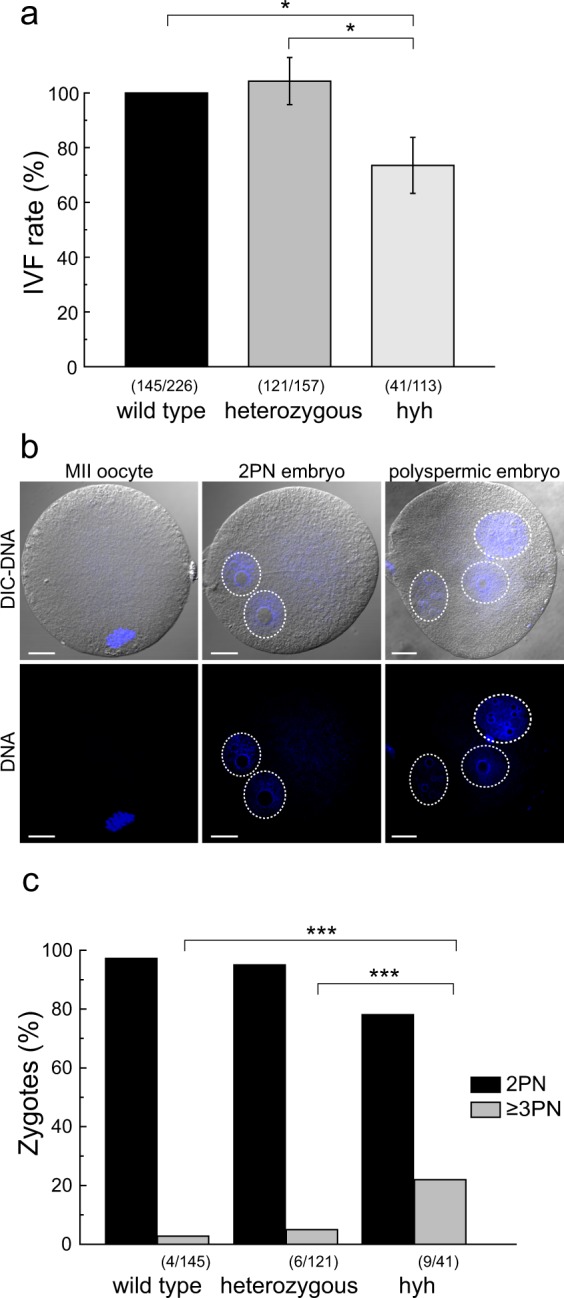
In vitro fertilization assays of MII oocytes superovulated from wild type, heterozygous and mutant homozygous (hyh) mouse ovaries. (a) In vitro fertilization (IVF) rate. MII oocytes from wild type, heterozygous and mutant homozygous (hyh) mice were coincubated with capacitated sperm from wild type mice; fertilization was evaluated after 6–8 h. Data are shown as mean ± SEM from at least 3 independent experiments; numbers in parentheses indicate the number of zygotes on total oocytes analyzed for each genotype assessed. IVF rates are relative to wild type group, set as 100%. *p ≤ 0.05 (Tukey’s test for multiple comparisons). (b) Representative confocal images of fixed cells that show the patterns obtained post IVF: unfertilized MII eggs (MII oocyte); normal fertilized egg with two pronuclei (2 PN embryo); polyspermic fertilized eggs that have three or more pronuclei (polyspermic embryo). Blue: DNA labeled with Hoechst 3342; grey: differential interference contrast (DIC) images. Images were taken at DNA confocal plane. Dotted white circles indicate pronuclei. Scale bar: 20 μm. (c) Incidence of polyspermy in hyh mice. Quantification of pronuclei in embryos from (b). Histogram show 2 PN and ≥3 PN zygotes rate in wild type, heterozygous and mutant homozygous (hyh) embryos obtained from IVF. Numbers in parentheses indicate the number of polyspermic (≥3 PN) zygotes from total analyzed embryos. ***p ≤ 0.001 (chi-squared test). At least 3 independent experiments were performed for each genotype.
