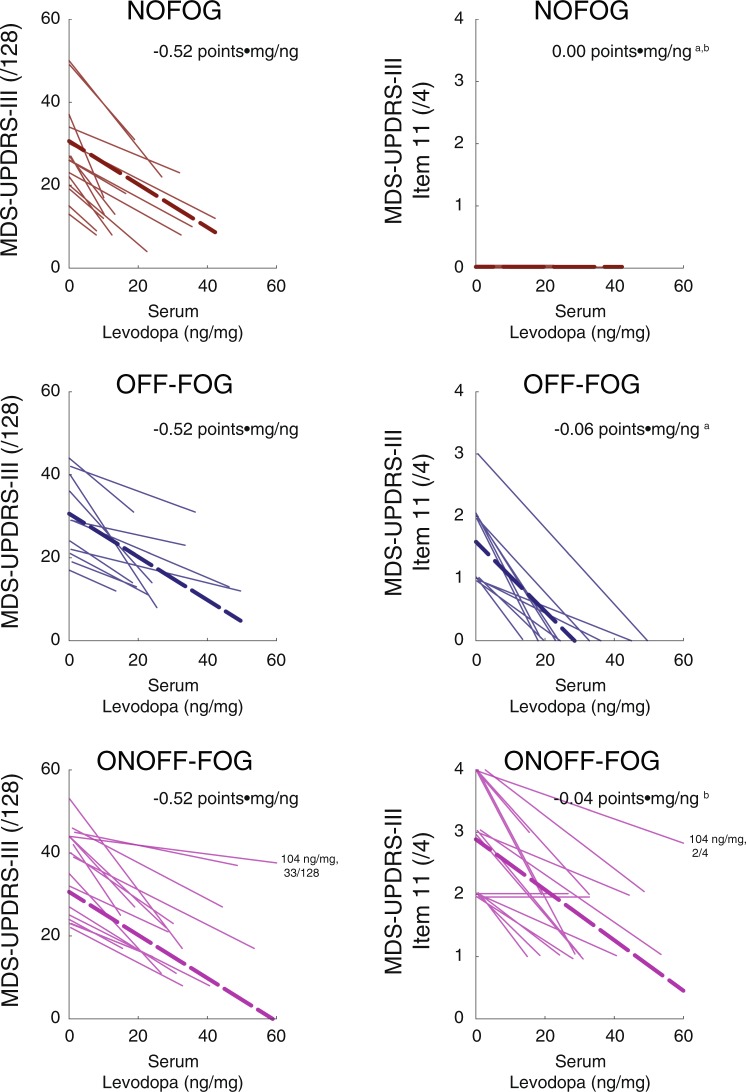
Fig. 3.
Changes in parkinsonian symptom level and changes in serum levodopa level among patients who exhibited a clinically-meaningful response to the acute levodopa challenge. Left: total MDS-UPDRS-III score (excluding item III.11, “Freezing of Gait”) and serum levodopa level. Right: MDS-UPDRS-III item III.11 and serum levodopa level. Study groups are depicted from top to bottom with colors as in Fig. 2. Thin lines depict increases in serum levodopa level and corresponding reductions in MDS-UPDRS-III from the OFF to ON states for individual patients. Scores for one patient in the ONOFF-FOG group with a very high ON state serum levodopa level (104 ng/mg) are noted. Bold dashed lines indicate linear regression fits estimated by linear mixed models. Inset: Beta values in points•mg/ng calculated by linear mixed models. a,bSignificant difference between slope parameters, mixed models, P < 0.05. Mixed model results control for PD duration. In the right panel, a small amount of vertical jitter has been added to improve visibility.

