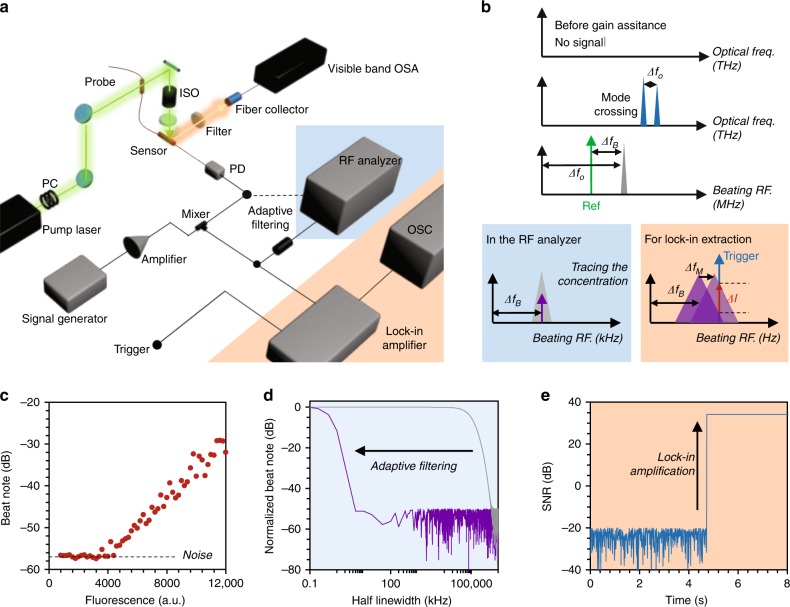
Fig. 2. Measurement with enhanced sensitivity.
a Experimental setup. We mark the optical paths by the green (pump) and orange (Rh6G fluorescence) arrows. The in-fiber laser is collected by a fast photodetector (PD), subsequently analyzed in the measurement electronics. PC: polarization controller; BPS: beam polarization splitter; ISO: isolator; OSA: optical spectrum analyzer; OSC: oscilloscope. b Below the threshold, no signal is detected due to prGO quenching, while selective FRET enables measurable optical mode-crossing ΔfO (at the MHz level). Beating with the reference sinusoidal signal, the crossing signal loads to a down-converted beat note at ΔfB (in the kHz level). In the RF, we track the peak of the beat note and measure its spectral shift (highlighted in the blue box). Through the oscilloscope, we extract and trace the beat note intensity change (ΔI) due to the crossing shift (ΔfM) using lock-in amplification (highlighted in the orange box). c The measured RF signals is determined by the fluorescent intensity, wherein the beat note is detectable when the fluorescence is higher than 4000 intensity counts. d Frequency response Bode plot based on the half-linewidth comparison. The adaptive filtering in the RF analyzer significantly reduces the beating linewidth from MHz to tens of Hz, enhancing the RF spectral resolution. e Signal-to-noise ratio (SNR) enhanced by the lock-in amplifier, with a 44 dB SNR.

