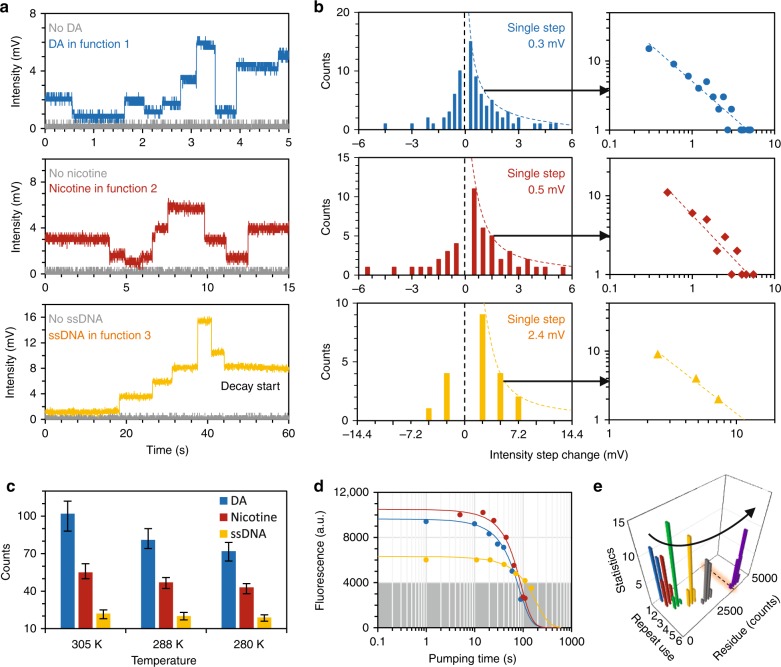
Fig. 4. Tracking individual molecular interactions.
a Discrete changes in these plots correspond to the beat frequency shifts, due to the Rh6G-prGO-target interactions in the FP sensor cavity. The gray curves show the case when there is no target molecule. b Statistical histograms show the discrete jumps in the fluorescence counts. After lock-in amplification, for DA, nicotine and ssDNA, the standard deviations are 0.3, 0.5, and 2.4 mV, respectively. The time-bin data obeys the power-law fitting. c On/off counts under varied temperature, determined by the Arrhenius equation in principle. The error bars shows the uncertainty in repeated measurements. d Bleaching time of the prGO sensors, illustrating the Rh6G bleaching under the pump laser. When the fluorescence is lower than 4000 a.u. intensity counts in OSA, the optical signal is below the dark noise of the PD. Typical bleaching time of the sensing is in the range of ≈100–150 s. e Reusability of the prGO-FP sensor cavity. Repeated dye injection degrades the prGO gradually, with a larger quenched residual fluorescence and thus deteriorating the quenching. After five times reuse, the quenched residual fluorescence is larger than the detection threshold (dashed line), disabling the selectivity.

