Fig. 6.
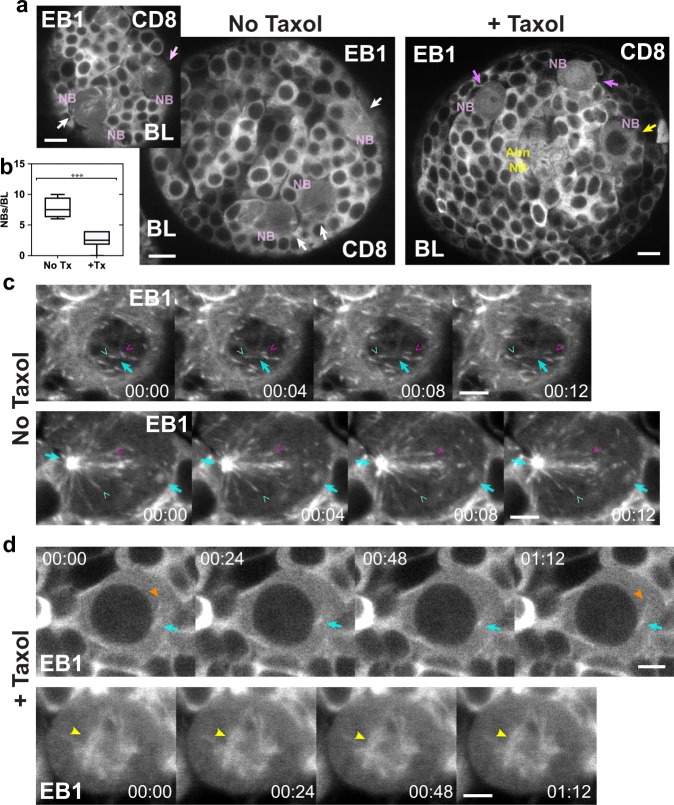
Taxol suppresses microtubule growth and elongation in larval brain NBs. a EB1-EGFP and CD8-GFP-labeled control (No Taxol) and Taxol-treated (+Taxol) BLs. Activated NBs (NB, pink) in control BLs (left) in prophase (top left, pink arrow) or mitosis (white arrows). NBs in Taxol-treated BLs (right) in prophase (yellow arrow) or mitosis (magenta arrows). Abnormal NB (Abn NB, yellow). b Plot, NBs in Taxol-treated BLs (+Tx; 2.5 ± 1.35 NBs/BL, mean ± SD, n = 25, n = 10 BLs) are reduced in frequency compared with controls (No Tx; 7.75 ± 1.71 NBs/BL, n = 31, n = 4 BLs; ***, P < 0.001, unpaired t-test). c Time-lapse images of control NBs in prophase (top) with the centrosome (cyan arrows) slightly above or below the plane of focus, or mitosis (bottom), showing rapid growth of single microtubules (green and magenta v’s; Supplementary Movies 3 and 4). d Taxol-treated NBs in prophase (top) with a small centrosome and faintly labeled microtubules (orange arrowheads) near the nucleus (black sphere) or in mitosis (bottom) with a rudimentary spindle (yellow arrowheads) and no growing or elongating microtubules (Supplementary Movies 5 and 6). Time, min:s. Bars, 6 µm (a); 3 µm (b, c).

