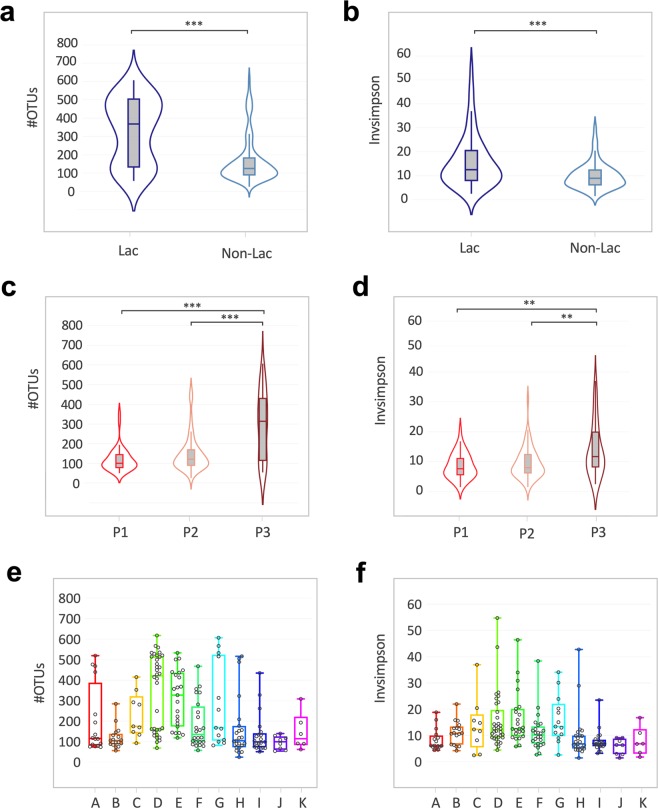
Figure 2.
Alpha diversity measurements for the vaginal microbiota of female rhesus monkeys. Violin plots of the observed OTUs and InvSimpson index clustered based on (a,b) lactation status (Mann-Witney t-test, ***p ≤ 0.0001) and (c,d) sexual cycle phases (P1: ovulatory phase, P2: intermediate stage, P3: menstruation-like) (Kruskal-Wallis test, **p ≤ 0.001, ***p ≤ 0.0001). (e,f) Boxplots (median ± range) of the observed OTUs and InvSimpson index clustered by breeding groups (groups association: A-K). See Table 1 for sample size composition.

