
Fig. 2.
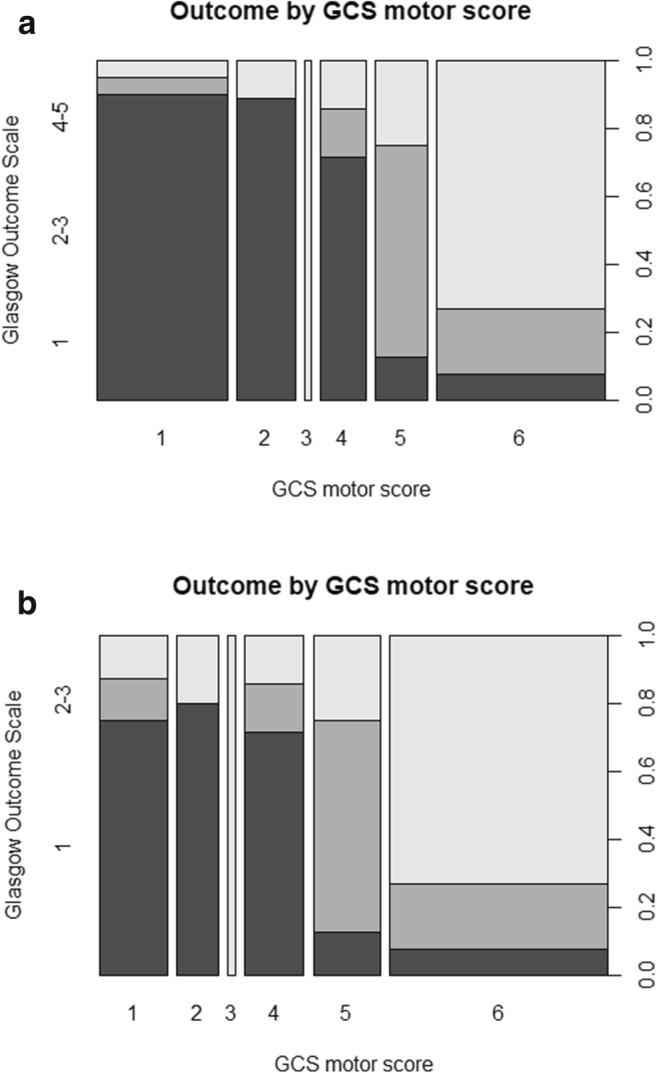
Spine plots illustrating the relationship between GCS motor score (x-axis) and functional outcome (y-axis, left) for the complete cohort (a) and the active treatment cohort (b). The right y-axis represents outcome proportions summing to 1. On the left y-axis, dark gray represents a GOS of 1, medium gray represents a GOS of 2 or 3, and light gray represents a GOS of 4 or 5. The sizes of the bins correspond to the number of patients in each category. GCS, Glasgow Coma Scale; GOS, Glasgow Outcome Scale