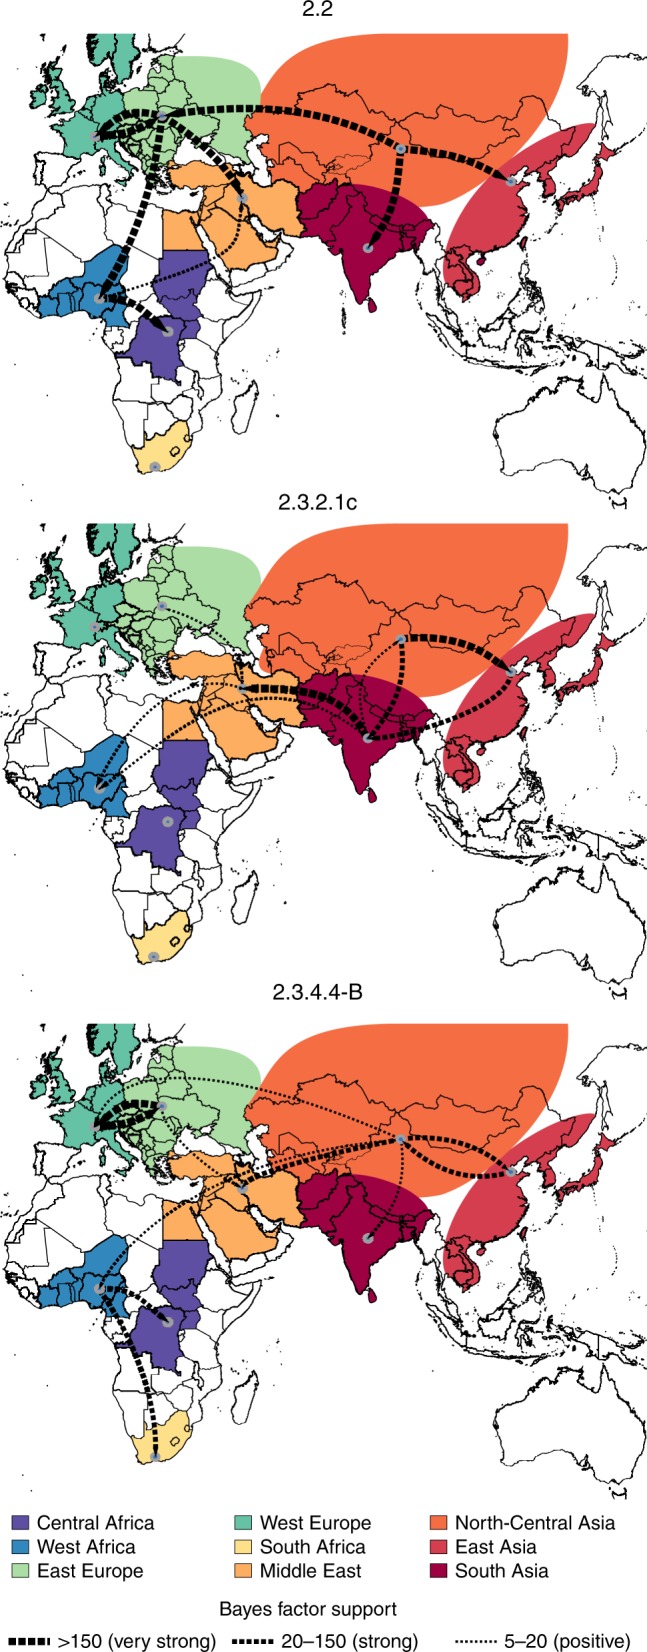
Fig. 1.

Global migration rates between geographic regions of the three HPAI H5Nx clades. Maps showing statistically supported non-zero rates (BF > 5) for clades 2.2, 2.3.2.1c and 2.3.4.4-B. Areas for each region type are labelled using the same colour in the annotated phylogenetic trees in Supplementary Figs. 3–5. The thickness of the dashed lines representing the rates is proportional to the relative strength by which rates are supported for the epi-based datasets shown in the Supplementary Table 1: very strong (BF > 150, thick lines), strong (20 < BF < 150, medium lines) and positive (5 < BF < 20, thin lines).
