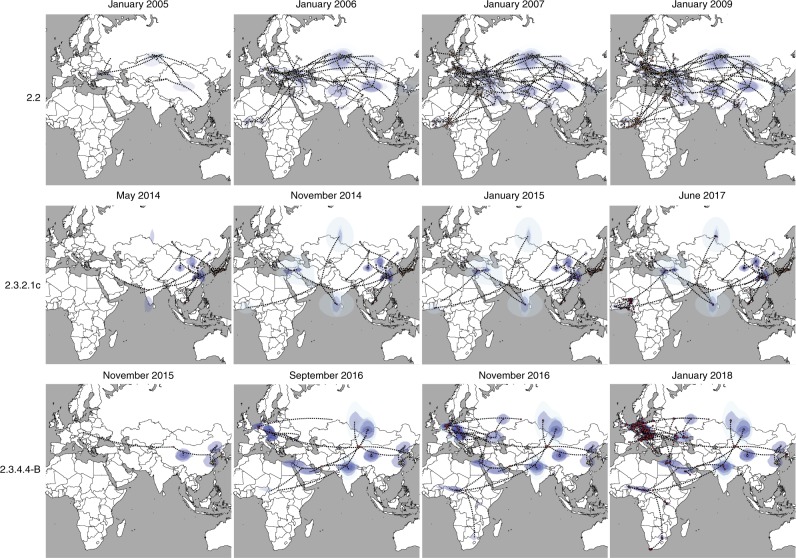
Fig. 2.
Global spatiotemporal dispersal of the three HPAI H5Nx clades. Dispersal patterns inferred using continuous phylogeographic analysis of the epi-based datasets are shown for four time slices for each of the three HPAI H5Nx clades. The black dashed lines and the dots represent part of the branches and the nodes of the MCC tree up to each of the indicated time. Dots are coloured according to the time (from yellow for the oldest to red for the youngest). Contours represent statistical uncertainty of the estimated locations at the internal nodes (95% credible contours based on kernel density estimates).

