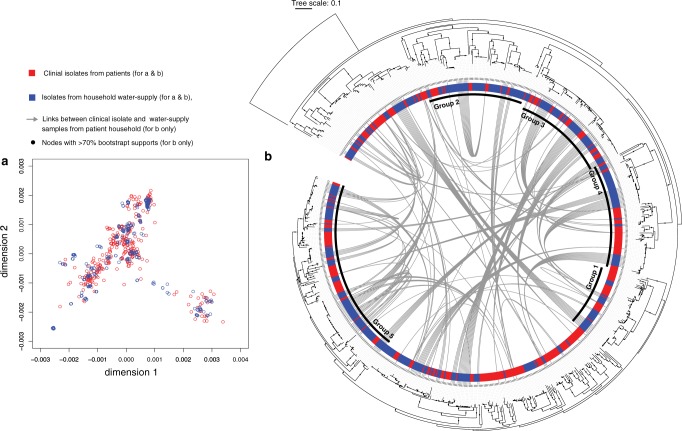
Fig. 2.
Population structure and phylogeny of B. pseudomallei isolated from patients and their household water supplies in northeast Thailand. a Multi-dimensional scaling based on the two dimensions that best explained data variability. b Maximum likelihood phylogeny generated from core gene SNPs in northeast Thailand isolates rooted on an Australasian outgroup Bp668. Nodes with bootstrap support of >70 are shown by black dots, with inner black rings presenting 5 monophyletic groups where detailed phylogeny-based analyses were performed. The outer coloured ring shows the isolate source. The grey arches represent an analysis of 27 cases who had a clinical isolates and up to 10 isolates cultured from their water supply, showing the connections for isolates from each case. Source data used to plot (a) is available in Supplementary Data 11.

