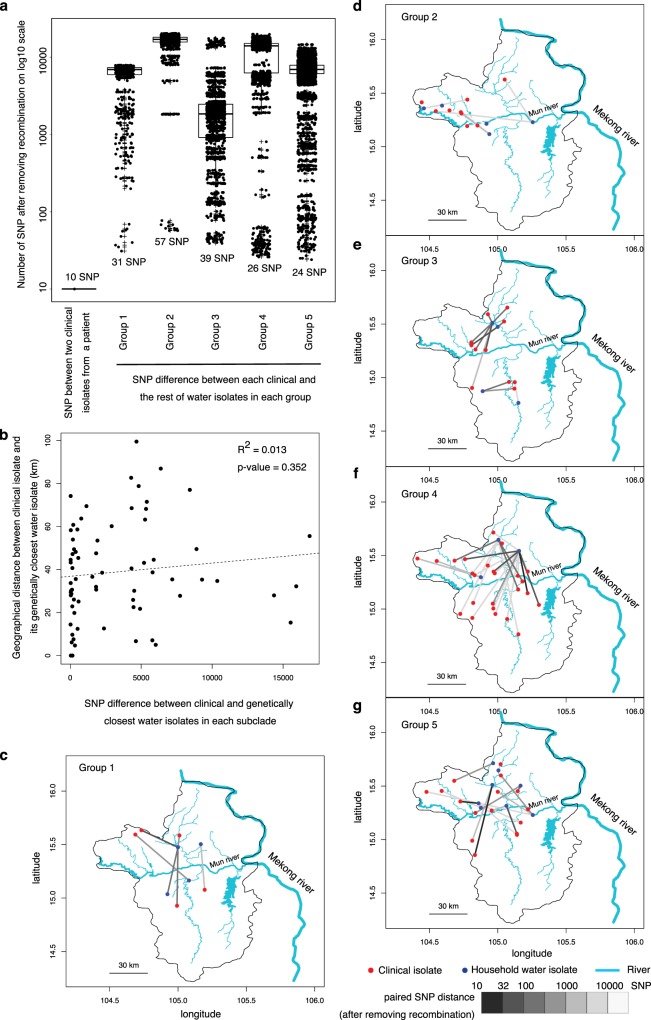
Fig. 3.
Genetic relatedness between clinical and environmental isolates from households. a Boxplot summarises pairwise SNPs distance between each clinical and its closest environmental isolate from each monophyletic group after removing recombination signals. A pairwise SNP distance between two clinical isolates cultured from the same patient were included as a threshold. b Correlation between pairwise SNP distance and geographical distance of clinical and its closest environmental isolates. c–g Geographical distance between clinical and its closest environmental isolates by monophyletic group. Red and blue dots represent clinical and environmental isolates, respectively. Colour shade of the links indicates the pairwise SNP distance between the pair. Source data used to plot (a) and (b) is available in Supplementary Datas 12 and 13, respectively.

