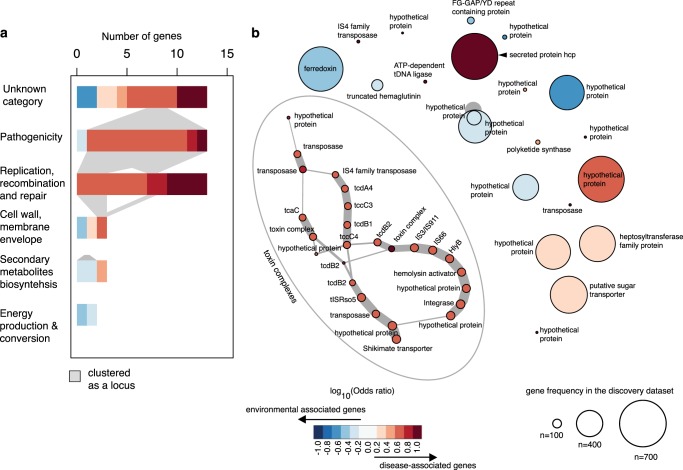
Fig. 4.
B. pseudomallei disease- and environmental-associated genes. a Bar charts summarise the frequency of disease- or environment- associated genes by functional category. The plots are ranked by categorical gene frequency from unknown category (n = 13 genes), potential roles in pathogenicity (n = 13 genes), replication, recombination and repair (n = 13 genes), cell wall membrane envelope biogenesis (n = 3 genes), secondary metabolite biosynthesis (n = 3 genes), and energy production and conservation (n = 2 genes). b Distance network reveals genetic loci enriched in disease- and environment-associated isolates. A network was constructed on distance between disease and environmental-associated genes that fell within the size of operon described by the transcriptional unit, as reported in Ooi et al. 2013. Each node represents each gene, with the edge thickness proportional to the frequency of each gene pair observed in the population. The largest disease-associated locus identified in this dataset was the toxin complex. For a and b, the colour indicates the effect size and directionality of association on the scale of log10(Odds ratio), with red and blue presenting association with disease and the environment, respectively.

