Fig. 5.
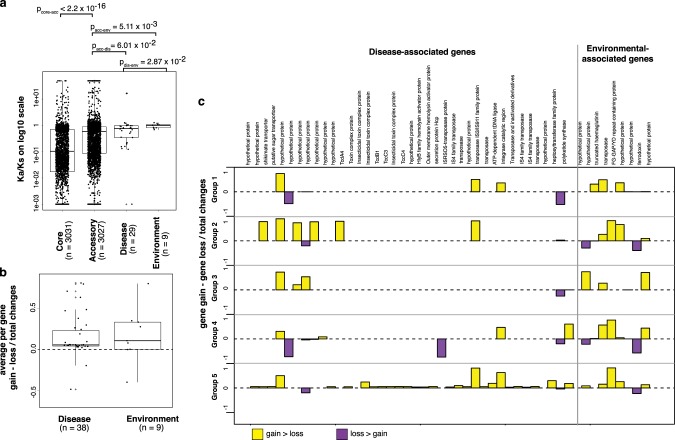
The selective pressure on disease- and environmental associated genes and the frequency at which they had been gained or lost throughout their evolutionary history. a The dN/dS of core genes, accessory genes, disease-associated genes, and environmental-associated genes are plotted on a log 10 scale. Two-sided Mann–Whitney U test was used to compare categorical observation. b The ratio of gene gain minus gene loss over the total gain and loss events for disease-associated genes and environmental associated genes. Independent observations were drawn from five monophyletic groups. ANOVA was employed to test the differences in group observation, where available treated as replicates for each gene. Where multiple observations were observed for each gene, a mean across different monophyletic groups was taken as an average. For a and b, boxplots summarise the distribution of data based on first quantile, median and third quantile. c A summary of net gain or loss events across all five groups. Yellow and purple bars indicate greater net gain and greater net loss of each gene. Source data used to plot (a) and (b) is available in Supplementary Datas 14 and 15, respectively.

