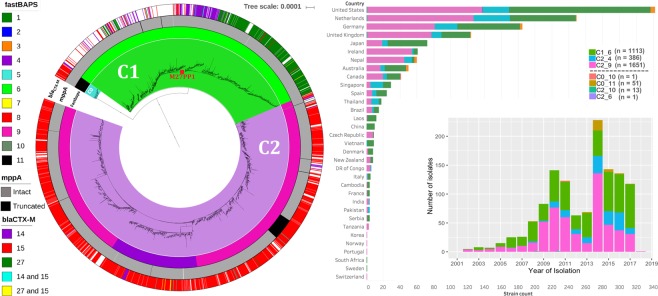
Figure 3.
(a) A maximum likelihood phylogeny of 3,224 ST131 Clade C isolates and (b) the distribution of these isolates across countries and over time. The phylogeny shows C0 (n = 52 genomes, blue), C1 (n = 1,121 genomes, bright green) and C2 (n = 2,051 genomes, purple). As per Fig. 2, the phylogeny constructed with RAxML from the 30,029 chromosome-wide SNPs arising by mutation was visualized with iTol. The inner colored strip surrounding the tree represents the subgroups formed from Fastbaps clustering and the cluster (1–11) associated with each isolate. This indicated most C0 were in Fastbaps cluster 11 (n = 52 genomes) with a single isolate in cluster 10 (grey). Of the 1,121 C1 isolates, 1,113 formed Fastbaps cluster 6 (green) and eight were assigned cluster 10 (black). The C2 subclades corresponded to Fastbaps clusters 9 (C2_9, n = 1,651 isolates, pink) and 4 (C2_4, n = 386, dark purple). The middle colored strip indicates the isolates with an interrupted mppA gene (black) relative to the wild-type intact version (grey). The outer colored strip is the blaCTX-M allele: 2,416 genomes had blaCTX-M-14, blaCTX-M-15, or blaCTX-M-27 genes, 1,790 genomes had blaCTX-M-15 (mainly C2), 177 genomes had blaCTX-M-14 (mainly C1) and 424 genomes had blaCTX-M-27 (mainly C1). The M27PP1 locus gain denoting the C1-M27 lineage (red box) was found in 468 C1_6 genomes (though independent events occurred too). The histograms in (b) show the distribution of sampling across countries, and that since 2002 both C1_6 (green) and C2_9 (pink) were common until the emergence of C2_4 (blue) and to a lesser extent C0 (brown).

