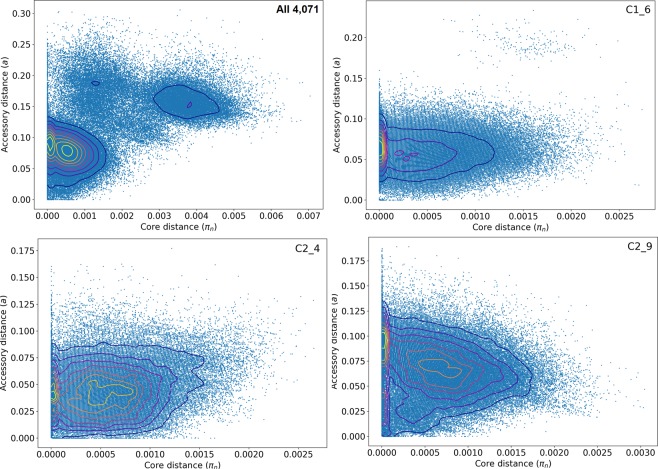
Figure 5.
The distribution of core (π, x-axis) and accessory pairwise genome distances (a, y-axis) with blue dots indicating isolate pairs and the contours indicating dot density (higher in yellow). Top left: All 4,071 assemblies displayed pairwise differences such that the contours indicated the three main clades: Clade A at π = 0.0038, a = 0.15; Clade B at π = 0.0014, a = 0.18; Clade C at both π = 0.0005, a = 0.08 and π = 0.0001, a = 0.09. Top right: 1,113 subclade C1_6 assemblies had a peaks mainly at π ≤ 0.001, a = 0.06. Bottom left: 386 subclade C2_4 assemblies had peaks at π = 0.0006, a = 0.045 and π = 0.0001, a = 0.040. Bottom right: 1,651 subclade C2_9 assemblies had peaks at π = 0.0007, a = 0.065 and π = 0.0, a = 0.090. Results for 2,416 blaCTX-M-positive Clade C assemblies and 52 subclade C0 assemblies were similar. Within subclades C1_6, C2_4, C2_9, isolates had more diverse accessory genomes compared to their core ones.

