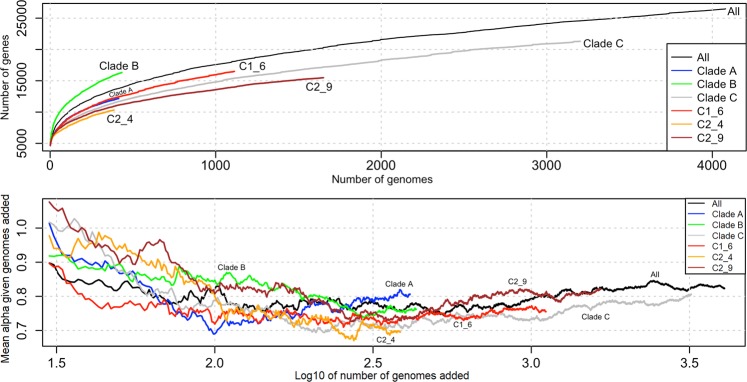
Figure 6.
Top: The average number of genes in the ST131 pangenome (y-axis) increased as the 4,071 genomes were added (x-axis) indicating an open pangenome for the whole collection (black), as well as its clades and subclades: Clade A (blue), Clade B (green), Clade C (grey), subclade C1_6 (red), subclade C2_4 (orange) and subclade C2_9 (brown). Below: Alpha varied with numbers of genomes sampled (shown here for >30 genomes) and was more independent from sample number once the number of genomes examined about >250. Note that the x-axis’ log10 scale.

