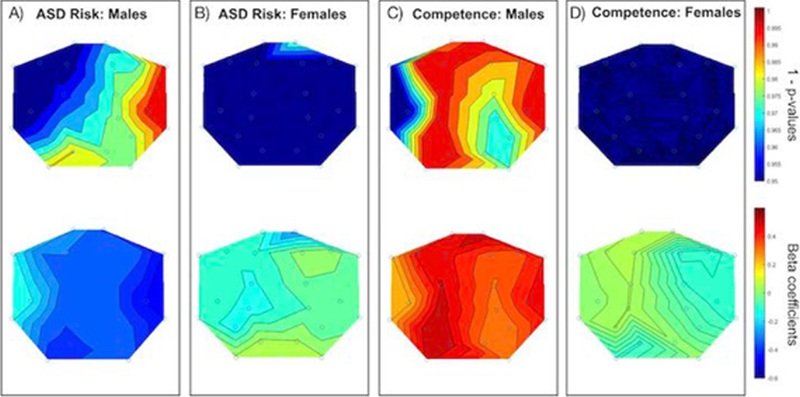
Figure 2. EEG Power at 16 – 18 Hz , ASD Risk, and Social-Emotional Competence.

Panels A and B display the scalp topography of 1 - p-values (upper) and beta coefficients (lower) for EEG power at 16 – 18 Hz in active sleep and BITSEA autism risk scores broken down by sex (Panel A: Males; Panel B: Females). Panels C and D are the same as A and B but for BITSEA competence scores.
