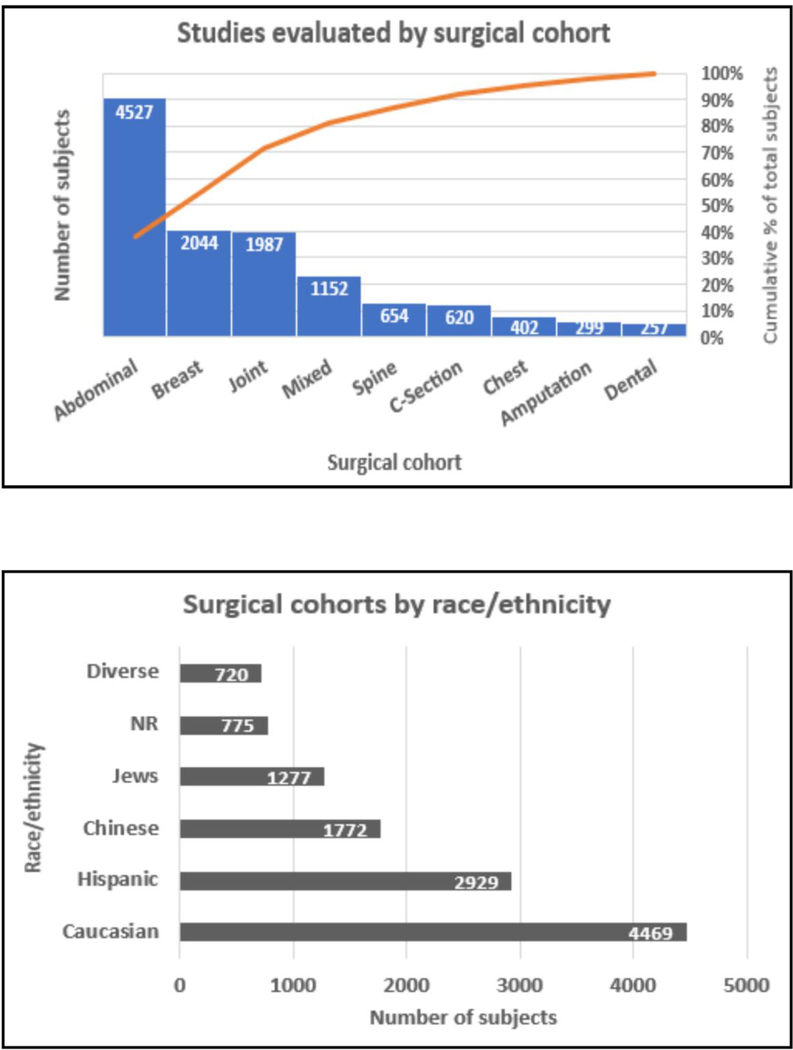
Figure 2:
Pareto chart and clustered bar chart depicting the different cohorts evaluated by studies in the systematic review by surgery (top panel) and race/ethnicity (lower panel) respectively are presented. Surgical cohorts have been classified according to the surgical incision location or type. For example, abdominal surgeries include hernia, gynecologic, urogenital surgeries etc. excluding caesarian sections which are presented as a different surgical class; joint surgeries include surgeries on any joint including knee, shoulder and hip surgeries. The pareto chart plots the distribution of the data in descending order of frequency (the number of patients per category marked on the bar). The red line is the cumulative line on the secondary y-axis showing % of subjects per surgical type/total number of patients. The clustered bar chart shows the number of subjects per ethnicity/race overall in the cohort (number per category marked on the bar). The Caucasian cohort includes several European populations (including Danish, German, Irish, Swedish) and North American populations. Jewish population includes both Ashkenazi and non-Ashkenazi Jew cohorts studied. Although the Hispanic cohort presents the second largest racial group, they are represented in only one large study. NR: Not reported.

