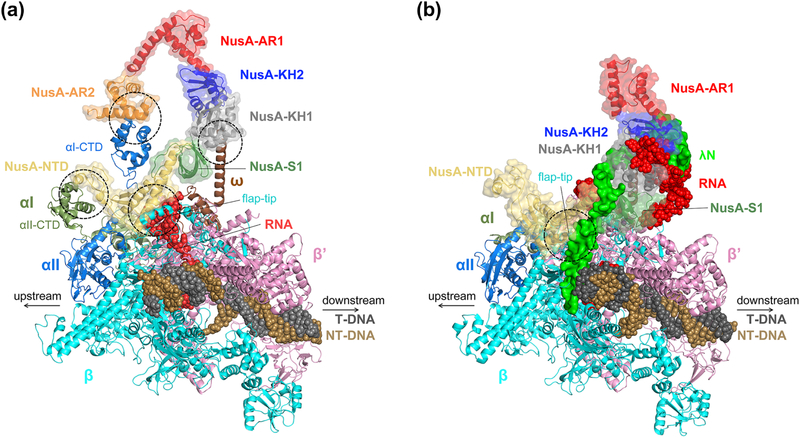
Figure 7. Comparison of NusA-bound hisPEC and λN anti-termination complex.
Protein region is drawn in cartoon format and nucleic acids are drawn as spheres. NusA is marked by a transparent surface and each domain of NusA is colored differently. A. hisPEC-NusA complex (PDB code: 6FLQ). The main contact points between RNAP and NusA are marked with dotted circles. B. λN anti-termination complex (PDB code: 6GOV) drawn from the same vantage point as in panel A. λN is drawn as a non-transparent green surface. The main contact point between RNAP and NusA is marked with a dotted circle. NusA-AR2 was disordered. NusB and NusE are not shown for clarity.

