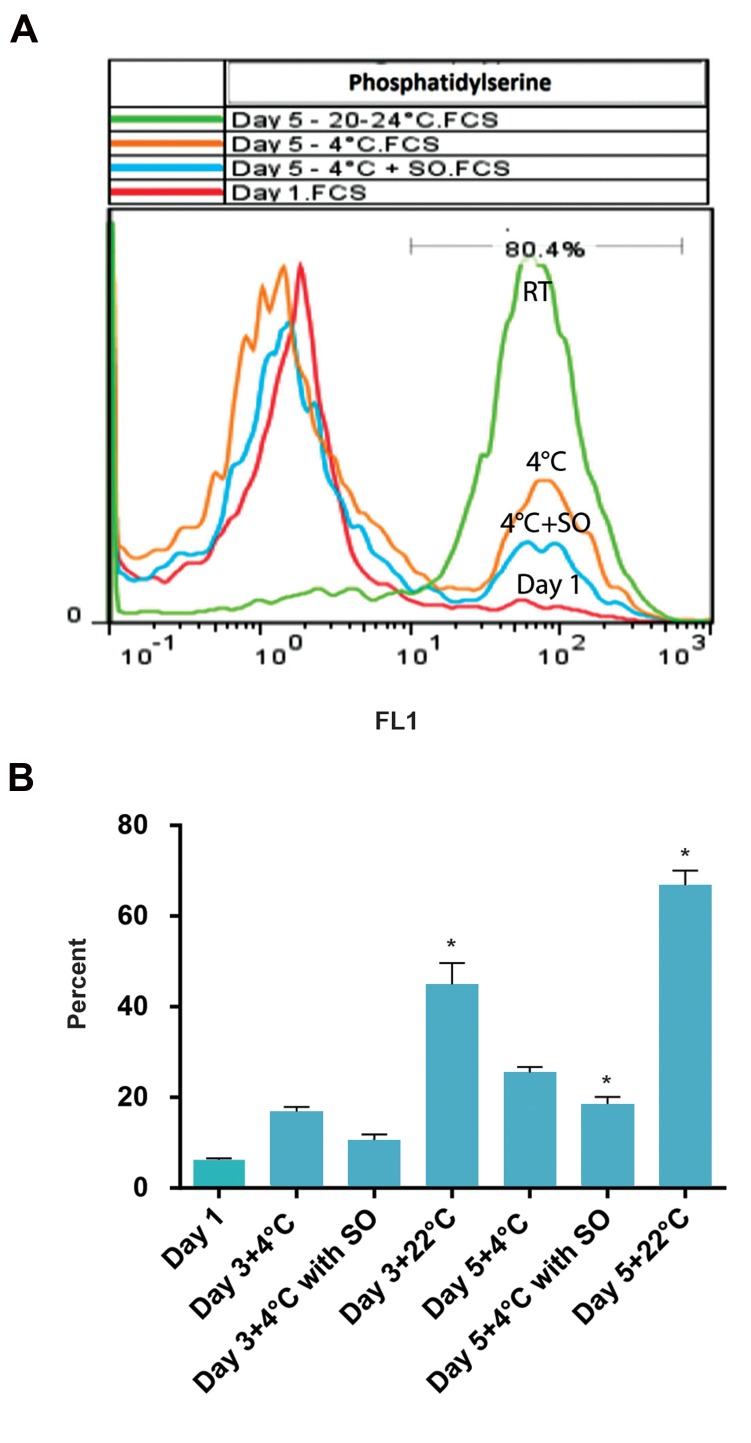
Fig 1.
The level of phosphatidylserine (PS) exposure on platelets. A. Flow cytometry plot. PS exposure on the fifth day of storage in three groups of platelets kept at 22˚C, 4˚C and 4˚C in the presence of sodium octanoate (SO). This figure shows higher levels of PS on platelets stored at 22˚C (P<0.05). SO caused lower PS exposure on platelets at 4˚C (P<0.05) and B. PS exposure levels on platelets on different days of storage in three groups of study. The lowest exposure of PS was seen in SO-treated platelets and the highest exposure was seen in platelets stored at 22˚C. *; P<0.05.

