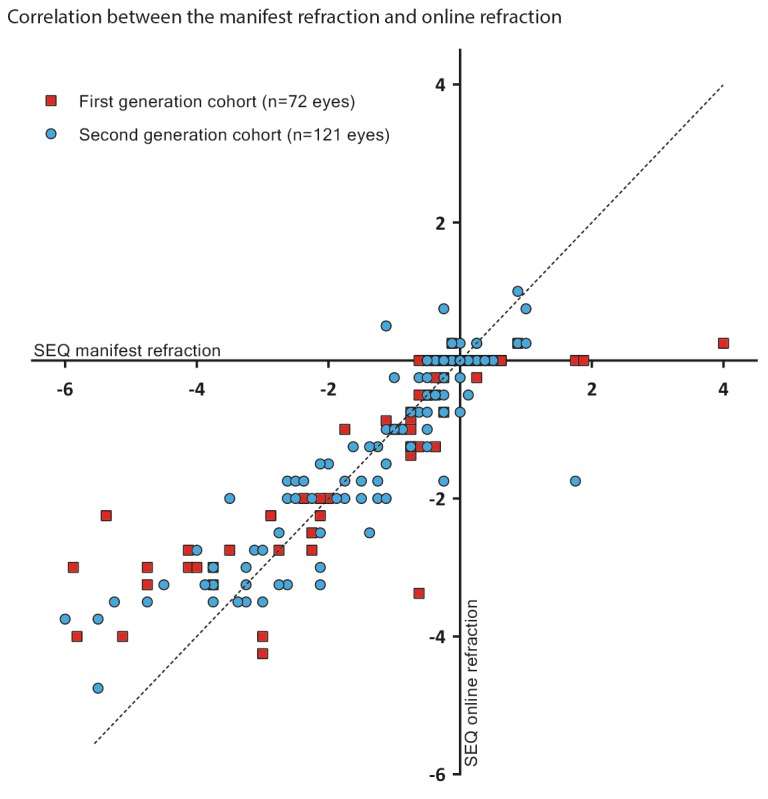
Figure 4.

Refractive error measured using the online test was plotted against refractive error measured using manifest refraction; each symbol represents an individual eye measured in a participant who was tested using the first-generation algorithm (red squares) or the second-generation algorithm (blue circles). The 45° dashed line represents an ideal fit. Outliers are identified particularly in the high-myopia group (bottom-left), and these differences are reduced in the second generation cohort. SEQ: spherical equivalent.
