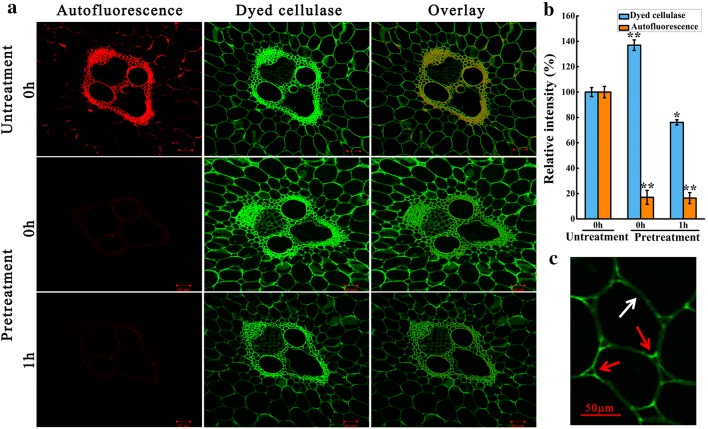
Fig. 5.
CLSM images of transverse section (10 µm in thickness). a The autofluorescence and dye-labeled fluorescence of cell walls (vascular bundle area) with or without alkali pretreatment. b The relative fluorescence intensities of dye-labeled cellulase and autofluorescence of samples at the same conditions, which were expressed as percentages compared with the intensities of fluorescence in untreated samples that were designated as 100%, respectively. c The changes in intensity of dye-labeled fluorescence between the corner (red arrows) and middle (white arrows) of alkali-pretreated parenchyma cell wall after hydrolysis of 1 h. Scale bars: 50 µm

