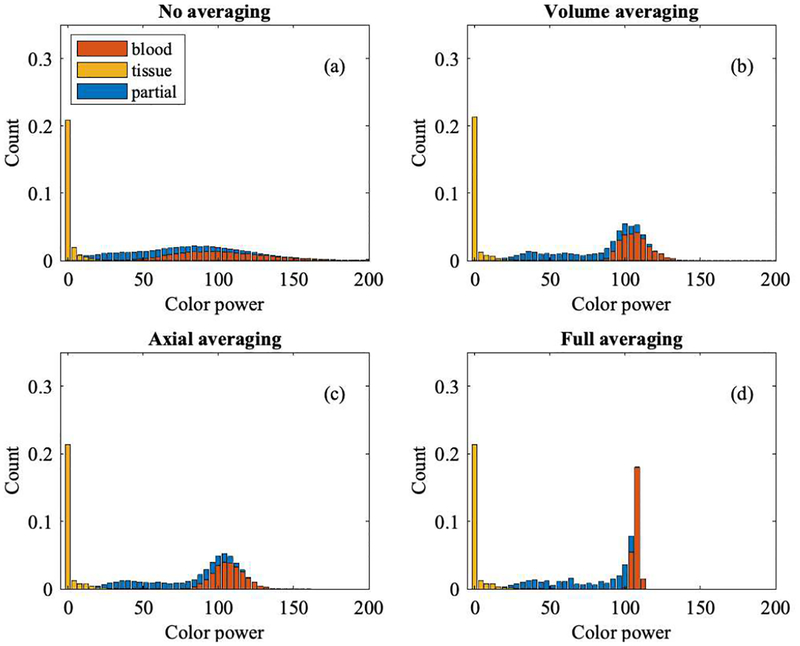
Fig. 10.
Histogram of color flow power (Study 2) coded by bar color as blood (red), tissue (yellow), and partial blood and tissue (blue). Non-averaged data are shown in panel (a). Averaging either by volume or axially yields the data shown in panels (b) and (c), respectively. Averaging both, by volume and axially, yields the histogram shown in panel (d). A higher level of averaging reduces speckle variation and therefore reduces the overlap of partial volume voxels with background tissue and with lumen/blood voxels.

