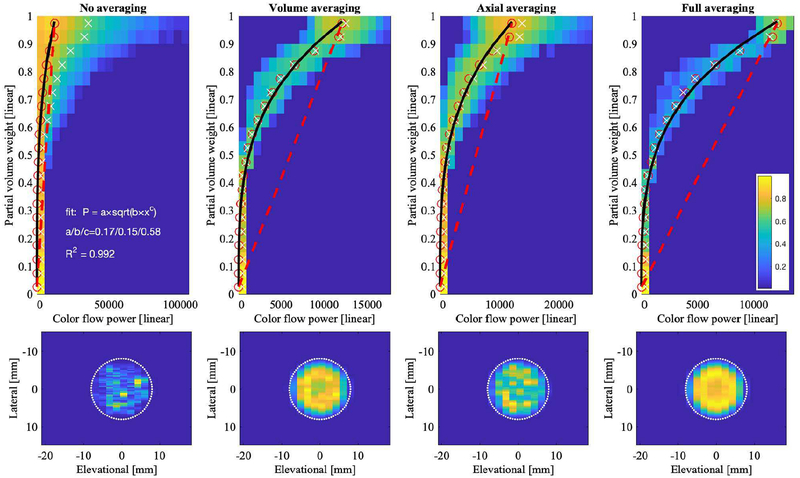
Fig. 11.
Relationship between partial voxel area and color flow power (Study 1) for raw and averaged data shown as 2D histograms. Color bar indicates normalized histogram count. Each column shows one type of averaging. Top row shows color flow power (abscissa) versus partial volume weight w from (2) (ordinate). Dashed red line indicates where power and partial voxel area are directly proportional. A fractional area of 0 and 1 correspond to background tissue and blood, respectively. Red open circles are computed as mean power in each fractional area bin. White ‘×’ are computed as the weighted mean, i.e., for each fractional area bin, the sum over all power values times their histogram count, normalized by the total histogram count in each fractional area bin. Black line histogram fit P is defined in the top left panel. Bottom row shows lateral-elevational lumen cross-section for each type of averaging. The simulated lumen (16-mm diameter) is indicated by the white dotted line.

