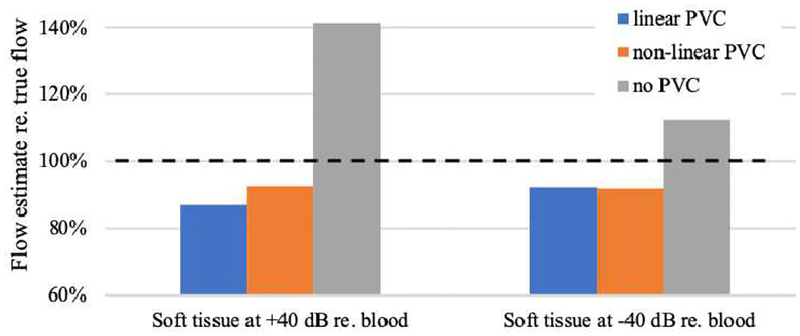
Fig. 13.
Volume flow estimation using simulated color flow data. Left three bars represent results for the simulation of blood flow in Study 1, whereas the right three bars represent those from Study 2. Each group shows estimated volume flow (Q) relative to true flow. Linear partial volume correction (PVC), as in [34], is shown in blue. Non-linear PVC, as resulting from this work, is shown in orange and uses the fit functions P(Figures 11 and 12) for Study 1 and Study 2, respectively. The third bar in each group represents the flow result for no PVC. Dashed horizontal line marks true volume flow at 100%. In Study 1, non-linear PVC estimates Q by 5.8% better than linear PVC. In Study 2, linear and non-linear PVC differ by 0.2%.

