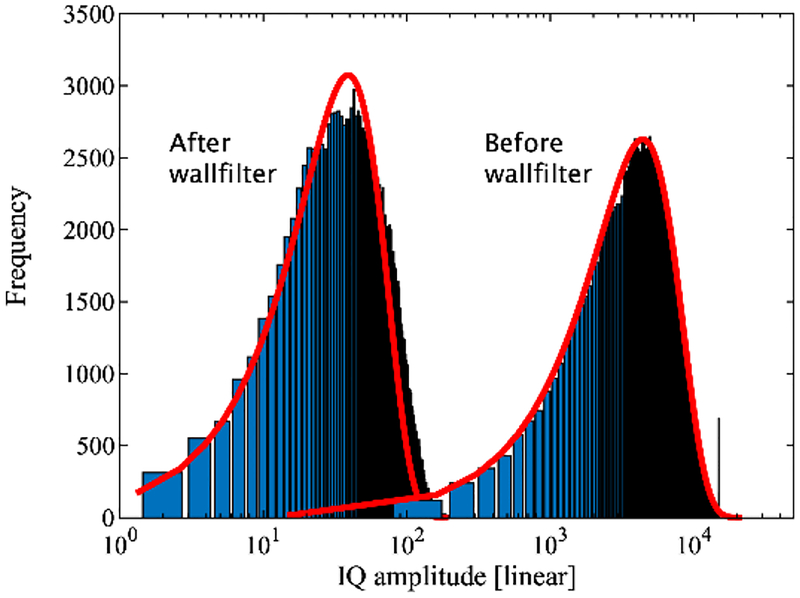
Fig. 2.
Histogram of IQ speckle amplitude distribution for a single volume. Before wall filter (right distribution) the signal is dominated by tissue, after wall filter it is dominated by the lower amplitude blood signal (left). The curve fits (red lines) reflect a Rayleigh distribution with two independent variables, mean and amplitude. [36]

