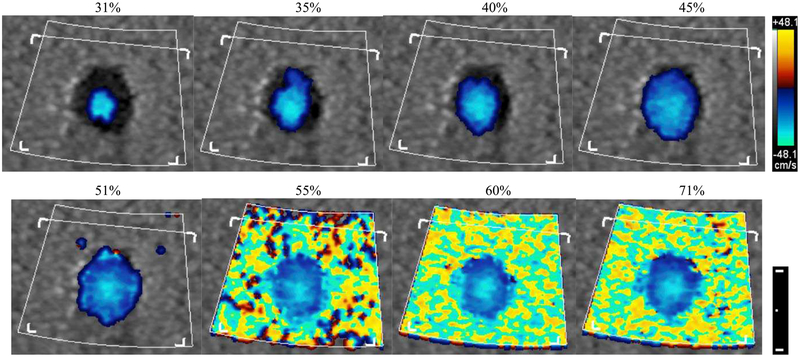
Fig. 3.
Color mode 2D (axial-lateral, centered at 4 cm depth) screen displays as a function of onscreen displayed color flow receive gain setting (noted above each image). Color and dimensional scale bar are shown on the right. The dimensional scale bar shows a 1 cm distance with a 5 mm subdivision.

