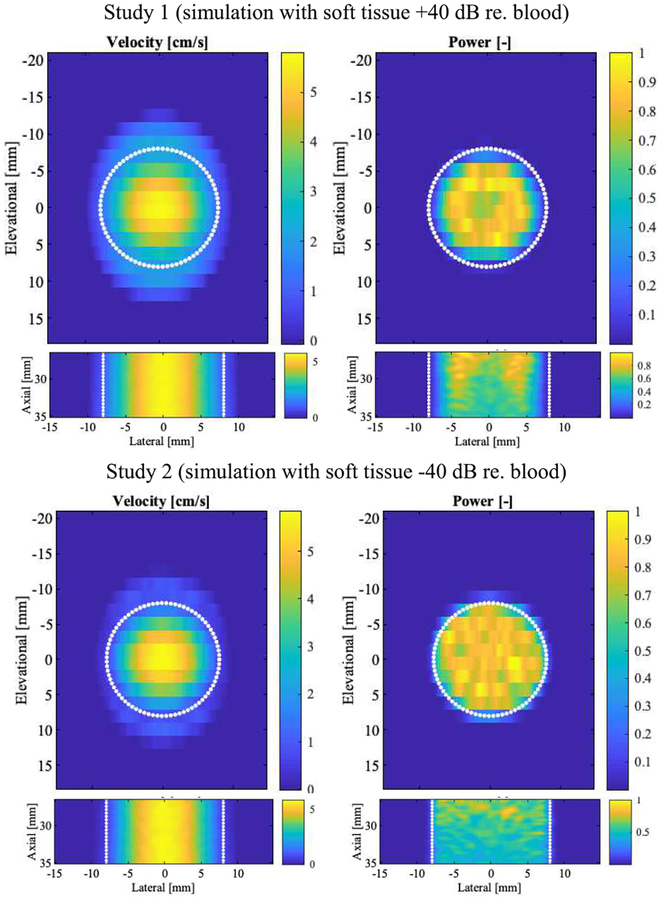
Fig. 5.
Simulation derived color flow velocity and power images. Columns show alternating velocity (cm/s) and normalized power on a linear scale. The top row presents c-plane cross-sections in the axial center of the simulated volume (27 to 35 mm axially, wall filter). The bottom row presents axial-lateral sections in the elevational center (no wall filter). The simulated lumen (16-mm diameter) is indicated by white dotted lines. Data is averaged (N=100).

